
DNA Methylation Analysis
Differentially methylated position (DMP) and region (DMR) analysis on the bundled synthetic Case/Control benchmark, then the full raw-IDAT pipeline for your own Illumina arrays (27K, 450K, EPIC v1, EPIC v2, or Mouse).
What you'll learn
- Load a pre-processed beta matrix CSV (Load Methyl Beta Matrix) or Illumina IDAT pairs (Load IDAT, mepylome engine) and attach a sample phenotype sheet via Merge Cell Meta.
- Run sample & probe QC (including the raw-signal plots for IDAT input), quantile-normalize, drop SNP / sex-chromosome / cross-reactive probes, and test for differentially methylated positions (DMPs) between two groups.
- Aggregate adjacent significant CpGs into differentially methylated regions (DMRs), render a genome-wide Manhattan plot, and follow up with a locus plot and CpG-bias-corrected GOmeth enrichment.
Prerequisites
- • Oreumics installed (install guide). The array manifest and probe annotation the loaders need, and the gene names Methyl GOmeth needs, are installed once through the Resource Center — a run never downloads them itself, so a template containing Load IDAT / Load Methyl Beta Matrix or Methyl GOmeth stops at that node until the resource is ready. Methyl GOmeth additionally queries the online Enrichr service.
- • Conceptual familiarity with array methylation: each sample × CpG-probe gives a beta value (0 = unmethylated, 1 = fully methylated). Defined in glossary below.
- • A sample phenotype CSV with a
sample_idcolumn matching the sample names (beta-matrix column headers, or the Sentrix ID_position IDAT prefixes) — Merge Cell Meta attaches the test/reference group label from it. - • Sample data:
sampledata/methylation/synthetic_beta_matrix.csv+synthetic_sample_sheet.csvwork out of the box. For real IDAT data, point Load IDAT at a folder of paired _Red / _Grn .idat (or .idat.gz) files, e.g. the bundledGSE295640_RAW/.
Dataset
Sample files (pre-packaged)
sampledata/methylation/synthetic_beta_matrix.csv— pre-processed beta matrix: 8 samples × 100 real EPIC probe IDs (samples × probes; the loader auto-detects orientation)sampledata/methylation/synthetic_sample_sheet.csv— columns: sample_id, group (Control / Case), sex, age, tissuesampledata/methylation/GSE295640_RAW/— real Illumina EPIC v1 IDAT pairs (32 samples, .idat.gz) for the IDAT loader workflow; idat_mini/ holds 3 of them with a sample_sheet.csvWhat it is
A tiny synthetic methylation benchmark — 8 samples split 4 vs. 4 across two groups (Control and Case) with sex, age and tissue covariates. The first 20 of its 100 probes carry a group-specific methylation difference, so DMP Analysis has something to find; it is designed to teach the pipeline shape, not to stand in for a study. Real IDAT data behaves identically apart from scale — point Load IDAT at the bundled GSE295640_RAW/ folder (or your own IDAT directory) and supply a sample sheet whose sample_id column matches the IDAT filename prefixes.
Beta vs. M-values
Beta values (0–1) are biologically interpretable (0 = unmethylated, 1 = fully methylated) but heteroscedastic. M-values (logit-transformed betas) are statistically better for testing. DMP Analysis tests on M-values when its use_m_values option is on (the default) while adata.X stays in beta scale, so the heatmaps and locus plots remain readable.
Beta Matrix to DMP
The core methylation pipeline on a pre-processed beta matrix: load the CSV, run per-sample and per-probe QC, quantile-normalize, filter confounding probes, attach the phenotype sheet, and test for differentially methylated positions between Case and Control. Ends with a heatmap of the top DMPs. This is the chain of the shipped Methylation — Full Pipeline (Beta Matrix to DMP / DMR, EPIC v2) template with Methyl QC and Methyl Normalize added back in (the template omits them because a vendor deliverable has usually had both already) and its array_type switched from epicv2 to auto for the synthetic file.
Pipeline (scroll →)
Load a pre-processed beta matrix (CSV/TSV/TXT, gzip OK). Orientation (probes × samples or samples × probes) and separator are auto-detected; vendor percent values (0–100) are divided down to 0–1; EPIC v2 replicate probes are collapsed. array_type: auto identifies the array from the probe IDs (450K / EPIC v1 / EPIC v2 / Mouse). This node — not Load IDAT — is the loader for CSV input.
beta_filesampledata/methylation/synthetic_beta_matrix.csvseparatorautoorientationautoarray_typeautothe shipped template pins epicv2 for vendor filesvalue_typebetaWhat you'll see
AnnData with samples as obs and CpG probes as var: 8 samples × 100 probes for the synthetic demo. adata.X contains beta values in [0, 1]. obs is empty apart from the sample IDs — the phenotype comes from Merge Cell Meta below.
Flag low-quality samples and probes without removing them. The call rate is the fraction of probes with a usable value per sample (and per probe across samples); min_call_rate_sample: 0.95 requires at least 95% of probes called per sample. mode: label adds pass/fail flags so you can review before committing to removal; the built-in violin plot draws each metric with the threshold line.
min_call_rate_sample0.95≥95% probes called per samplemin_call_rate_probe0.95≥95% samples call each probemodelabelplot_typeviolinWhat you'll see
obs gains call_rate, mean_beta and QC_pass; var gains probe_call_rate. For the synthetic demo, all 8 samples pass. The raw-signal plot types (intensity, control_strip, detection_p, snp_heatmap) need IDAT input and are covered in Template 2.
Apply NaN-aware between-array quantile normalization in beta space. Quantile normalization forces the beta distribution of every sample to be identical — a strong correction appropriate when samples come from different batches; choose method: none to skip it. Raw-signal corrections (NOOB, SWAN) are not offered here because they need the Red/Grn intensities — they live on Load IDAT's prep option (Template 2). Earlier versions listed bmiq/noob on this node; those values are retired and fail with a migration message. convert_to_m: false keeps beta values in X for interpretability.
methodquantilequantile or noneconvert_to_mfalseWhat you'll see
adata.X updated with quantile-normalized beta values and layers["normalized_beta"] added. The norm_comparison plot type of Methyl Visualization compares raw vs. normalized densities.
Remove probes that confound methylation analysis — mandatory before DMP. SNP probes (rs* and the manifest SNP set) reflect genotype rather than methylation. remove_sex_chr drops chrX/chrY so a mixed-sex cohort does not confound autosomal DMP discovery. remove_cross_reactive applies the bundled (or your own CSV) cross-reactive blacklist. min_call_rate drops probes below the call-rate floor. All four default to on.
remove_snp_probestrueremove_sex_chrtruedefault; turn off only for single-sex cohortsremove_cross_reactivetruemin_call_rate0.95What you'll see
Confounding probes removed; the node card reports how many were dropped per rule. On a full array the SNP and cross-reactive sets together remove tens of thousands of probes.
Attach the phenotype sheet to obs. match_by: cell_id joins one CSV row per sample on id_col; the live match-rate preview shows how many samples matched before you run. This is the standard way to bring group / sex / age into a methylation AnnData.
meta_filesampledata/methylation/synthetic_sample_sheet.csvmatch_bycell_idid_colsample_idWhat you'll see
obs gains group, sex, age and tissue for all 8 samples (match rate 100%).
Test each probe between the test group and the reference group — a vectorized Welch t-test by default, or a limma-style moderated t-test (test: moderated) that shares variance across probes and is steadier for small groups. Testing happens on M-values (use_m_values: true). delta_beta_threshold: 0.1 imposes a minimum effect size of 10% methylation change; this dual threshold (BH FDR + effect size) removes hits that are significant but biologically trivial. reference_group / test_group are dropdowns populated from condition_col.
condition_colgroupobs column from the sample sheetreference_groupControltest_groupCasetestwelchor moderateduse_m_valuestruealpha0.05delta_beta_threshold0.1≥10% methylation differenceWhat you'll see
DMP table stored in adata.uns["dmp_results"]. For the synthetic demo the 20 probes with injected signal should come out as DMPs at FDR < 0.05 and |Δβ| > 0.1. For real EPIC-scale studies the count depends entirely on the biology and the group sizes. Three or more groups? Use Multi-Group DM (3+ groups) instead — an omnibus moderated F-test plus a contrast per group.
Render a clustered heatmap of the top DMPs (selection_mode: top_dmp). Beta values are shown on their native [0,1] scale. color_by adds a sample colour bar for the group label; dendrogram clusters probes and samples hierarchically.
plot_typeheatmapn_top_probes50selection_modetop_dmpcolor_bygroupdendrogramtrueWhat you'll see
Heatmap with a two-block structure: probes hypermethylated in Case and probes hypomethylated in Case. The sample columns should cluster cleanly by group, with the Case and Control samples landing in distinct dendrogram branches.
Tip
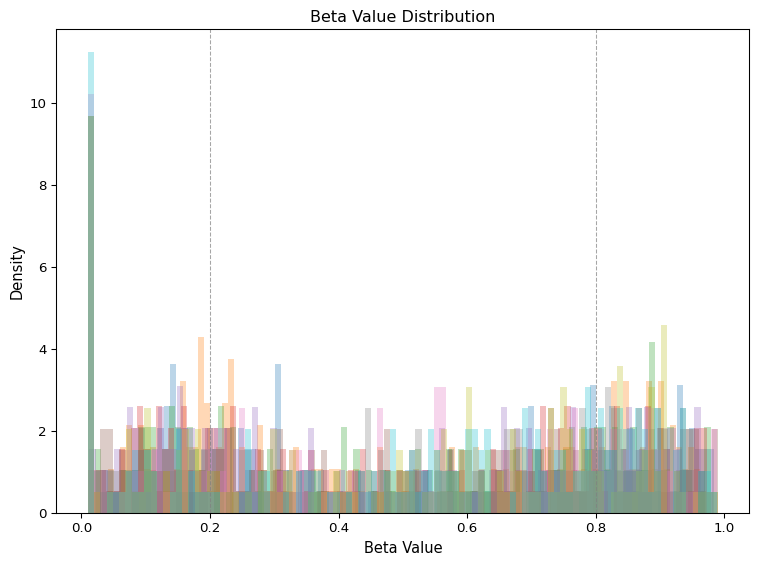
Other plot types on the same node: beta_dist, norm_comparison, beta_by_type, qq_plot, manhattan, sample_pca, volcano, cpg_boxplot, feature_distribution. Every one has its own Visualization Workspace.
IDAT to DMP / DMR + Manhattan Plot
The shipped Methylation — Full Pipeline (IDAT to DMP / DMR) template starts from raw Illumina IDAT pairs and extends the DMP pipeline with DMR (Differentially Methylated Region) detection, a genome-wide Manhattan plot, a locus plot for the top DMR and CpG-bias-corrected GOmeth enrichment. DMRs aggregate nearby significant CpG sites into biologically meaningful genomic intervals. The steps shared with Template 1 (QC, Normalize, Filter, Merge Cell Meta, DMP) are listed only where the IDAT path differs.
Pipeline (scroll →)
The template also hangs four raw-signal QC figures off the loader (Methyl QC with plot_type intensity, control_strip, detection_p, snp_heatmap), raw-vs-normalized and Type I/II density checks off the normalizer, and per-CpG group boxplots, a QQ plot, a volcano, sample PCA and feature-distribution panels off the DMP results. Its Merge Cell Meta node ships with an empty meta_file — point it at your sample sheet.
Point idat_dir at a folder of paired _Grn / _Red .idat (or .idat.gz) files; the search is recursive. Oreumics reads them with mepylome — one code path for 27K / 450K / EPIC v1 / EPIC v2 / Mouse — using methylprep only as a manifest and annotation provider (installed via the Resource Center). array_type: auto detects the array. prep chooses the raw-signal preprocessing applied before betas are computed: illumina (Illumina's own scaling, the default), noob (real out-of-band background correction — what the template uses), swan (within-array Type I/II correction; samples probes randomly, so it is not reproducible run to run), or raw. EPIC v2 replicate probes are collapsed with replicate_method.
idat_dirsampledata/methylation/GSE295640_RAW/or idat_mini/ for a 3-sample smoke runarray_typeauto27K / 450K / EPIC v1 / EPIC v2 / Mouseprepnoobillumina (default) / noob / swan / rawcollapse_replicatestruereplicate_methodmeanvalue_typebetaWhat you'll see
AnnData with samples (Sentrix ID_position names) as obs and CpG probes as var; adata.X holds beta values. The loader also stores a raw-signal summary in uns["methyl_signal_qc"] — no intensity matrices are kept — which is what the four signal-QC plot types read.
On IDAT input, Methyl QC can draw the four figures minfi / sesame users open first, one node per plot_type: intensity (per-sample median methylated vs. unmethylated log intensity), control_strip (Illumina control probes — default the two bisulfite-conversion types; 'all' shows every type), detection_p (per-sample detection p summary; detection_convention picks minfi_mean with its 0.01 line or poobah_fraction with its 0.05 line — the cutoffs are not interchangeable) and snp_heatmap (SNP-probe genotype identity check for sample swaps). These error by design on a vendor beta matrix.
plot_typedetection_palso intensity / control_strip / snp_heatmapdetection_conventionminfi_meanmodelabelWhat you'll see
Read-only diagnostic figures; the call-rate QC columns are written as in Template 1.
Group nearby significant DMPs into contiguous genomic regions (Bumphunter-style). min_probes: 3 requires at least 3 consecutive significant CpG probes to form a region — single isolated DMPs do not constitute a DMR. max_gap_bp: 1000 sets the maximum allowed gap between consecutive probes within a region. require_same_direction keeps regions where all probes agree in direction; smooth_window applies an optional rolling mean. Needs chr/pos in var, which the manifest annotation provides.
min_probes3≥3 consecutive significant probesmax_gap_bp1000max gap between probes in a regionrequire_same_directiontruesmooth_window0alpha0.05delta_beta_threshold0.1What you'll see
DMR table stored in adata.uns["dmr_results"] with genomic coordinates, probe count and per-region statistics. On the 100-probe synthetic demo DMRs are unlikely (the probes are scattered across the genome); on real array data the count depends on the biology and on probe spacing — regions with sparse coverage never produce DMRs regardless of significance.
Tip
If too few DMRs are found, increase max_gap_bp to 2000 to allow larger gaps between probes in a region, or lower min_probes to 2 (though 2-probe DMRs are less reliable).
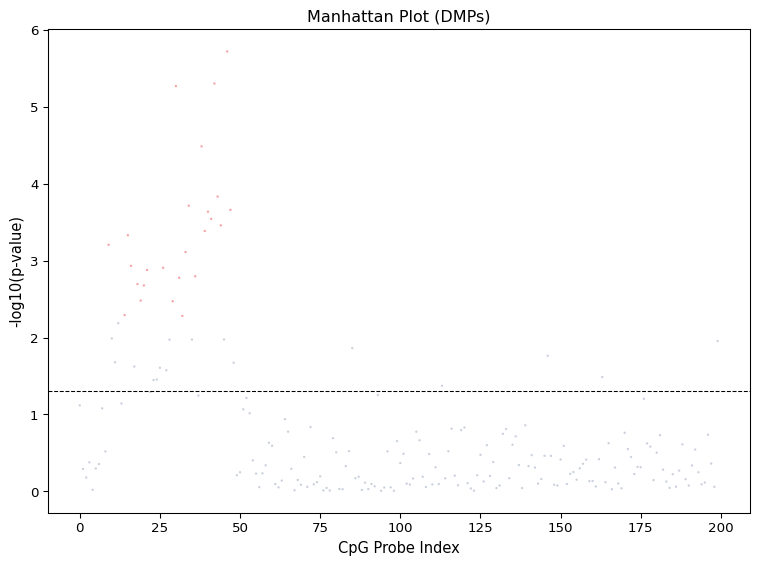
Plot -log10(p-value) for every tested DMP by cumulative genomic position (x_axis_mode: genomic), with alternating chromosome colours. y_axis_mode: capped keeps extreme hits from squashing the rest of the plot without changing the stored p-values; y_cap sets the cap explicitly. A QQ plot (plot_type: qq_plot) and a volcano (plot_type: volcano, n_label top hits annotated) sit on sibling nodes in the template.
plot_typemanhattanx_axis_modegenomicy_axis_modecappedalpha0.05What you'll see
A genome-wide Manhattan plot. For real studies the chromosomal distribution of peaks is the most informative biological signal: clustered peaks on a single chromosome arm hint at large-scale epigenetic remodelling, while scattered peaks indicate broad genome-wide change.
Genome-browser-style view of one DMR: per-sample beta values and group means along the region, with the DMR span shaded and padding_bp of flanking sequence. dmr_rank: 1 picks the top DMR by adjusted p-value; set chr / start / end to look at any locus instead.
dmr_rank1padding_bp5000color_bygroupsame column as DMP condition_colWhat you'll see
Per-sample dots and group-mean lines across the locus; a convincing DMR shows the two groups separating across several adjacent probes.
Gene-set enrichment for the DMP results with the CpG-density bias correction of the gometh method — plain hypergeometric tests are biased toward CpG-rich genes. direction tests all, hyper, hypo, or both separately while keeping one tested-CpG universe. Gene names come from the zhou-lab annotation (installed via the Resource Center) and the libraries from Enrichr (online).
gene_set_libraryKEGG_2021_Humanorganismhumandirectionallbias_correctiontruetop_n15What you'll see
uns["methyl_gometh_results"] plus a bar plot of the top terms, significant terms coloured separately. The Methylation — Pathway Discovery template runs KEGG and GO Biological Process side by side.
Expected Results
Synthetic demo (8 samples × 100 probes)
- • Loading: Load Methyl Beta Matrix, orientation auto-detected; all 8 samples pass Methyl QC
- • Merge Cell Meta: 100% match on sample_id; group / sex / age / tissue in obs
- • DMP Analysis (Case vs. Control): the 20 injected probes recovered at FDR < 0.05 and |Δβ| > 0.1
- • DMR Analysis: likely none — 100 scattered probes cannot form 3-probe regions; a sanity check, not a discovery
Real IDAT data — what to expect
- • Loading: every IDAT pair becomes one sample; the four raw-signal QC plots become available
- • Methyl Filter: tens of thousands of SNP-associated, sex-chromosome and cross-reactive probes removed before testing
- • DMP / DMR counts: depend on the biology, group sizes and the |Δβ| threshold — read them off the node cards rather than a rule of thumb
- • Manhattan plot: chromosomal distribution reflects the underlying biology — clustered or scattered depending on study design
Tips & Troubleshooting
IDAT files not detected
Load IDAT looks recursively for paired _Red and _Grn files (.idat or .idat.gz) in idat_dir; a folder with only one channel (some GEO submissions ship Green only) cannot be loaded. Sample names follow the Illumina "SentrixID_SentrixPosition" prefix, so your sample sheet's sample_id column must use the same strings. Files locked by document-rights management (Fasoo DRM) are detected and refused with a clear message.
Using a pre-processed CSV instead of IDAT files
Use Load Methyl Beta Matrix (beta_file), not Load IDAT. It auto-detects orientation and separator, divides vendor percentages down to 0–1, and collapses EPIC v2 replicate probes. Raw-signal QC plots and NOOB/SWAN are unavailable on this path because there is no Red/Grn signal.
Too few DMPs found
Lower delta_beta_threshold from 0.1 to 0.05 to capture smaller methylation changes, or switch test to moderated so variance is shared across probes. Also check that your sample sizes are sufficient — DMP analysis needs at least 3 samples per group for reasonable statistical power. For very small studies (n=2 per group), DMP results should be treated as exploratory only.
No DMRs found despite many DMPs
Increase max_gap_bp from 1000 to 2000 to allow larger gaps between probes in a region. You can also lower min_probes from 3 to 2, though 2-probe DMRs are less reliable. Note that on the 450K array, probe spacing is irregular — regions with sparse probe coverage will never produce DMRs regardless of significance.
Going Further
- Ask where the DMPs sit in the genome with DMP Feature Enrichment — a Fisher test of significant DMPs against a local BED annotation or the cached ENCODE SCREEN cCRE classes, with BH FDR and a 95% CI forest plot; hyper and hypo can be tested separately.
- The Methylation — Visual EDA (no phenotype required) template gives a quick look at a beta matrix (distributions, probe types, sample PCA) before any group labels exist.
- For comparable downstream pipeline patterns at the gene level (volcano, heatmap, GO terms), see the Bulk RNA-seq tutorial.
Glossary
- Beta value
- For each CpG probe, the ratio M / (M + U + offset) where M and U are methylated/unmethylated probe intensities. Range [0, 1]. 0 = unmethylated; 1 = fully methylated.
- M-value
- log2(beta / (1 - beta)) — the logit of beta. M-values are statistically more amenable to testing than betas. DMP Analysis tests on them when use_m_values is on; adata.X usually stays in beta scale for interpretability.
- DMP (Differentially Methylated Position)
- A single CpG probe whose methylation differs significantly between two sample groups (FDR < alpha and |delta beta| > threshold).
- DMR (Differentially Methylated Region)
- A contiguous genomic stretch of ≥min_probes significant DMPs separated by ≤max_gap_bp, found Bumphunter-style. Reflects coordinated methylation change across a regulatory element.
- EPIC / 450K / 27K / Mouse
- Illumina's methylation arrays. All are read by Load IDAT through the mepylome engine; the array type is auto-detected from the IDATs (or from probe IDs for a beta matrix). The manifest and annotation are installed via the Resource Center.
- Merge Cell Meta
- The node that attaches a sample sheet (CSV/TSV/Excel) to obs by matching sample IDs — the standard way to give a methylation dataset its phenotype. Not the loader's sample_sheet option.
- SNP probes
- CpG probes that overlap known common SNPs — methylation calls at these probes reflect genotype rather than true methylation. Always remove with Methyl Filter.