
Put the cut where the distribution says, not where the paper did.
Run the Quality Control node once and open its workspace. Every threshold you drag re-colours the histograms, redraws the scatter and recounts the cells that pass — in the browser, with no call back to the pipeline. When the numbers look right, Apply & Close writes them to the node and re-runs it.
One node computes the metrics, filters the cells, and hands the workspace its data.
The node runs scanpy’s calculate_qc_metrics1 with mitochondrial, ribosomal and haemoglobin gene sets picked out by prefix, applies the filters you enabled, and stamps the result so downstream nodes know the cells were already filtered. Setup lives in the workspace too — which data layer holds the counts, the three gene prefixes, and whether metrics are log-transformed — and changing any of them re-runs the node.
- Per-cell metrics — genes per cell, total counts, % mito, % ribo, % Hb — sent to the workspace for up to 50,000 cells (larger datasets are sampled for the plots; the filter itself runs on every cell).
- Knee data — barcode rank against UMI count, so the workspace can show the empty-droplet boundary.
- Recommended thresholds — computed from the median and MAD of each metric — the values behind every rec: button.
- PASS / FAIL counts — and an optional QC plot (violin, scatter or histogram) coloured by any obs column, with per-group colours.
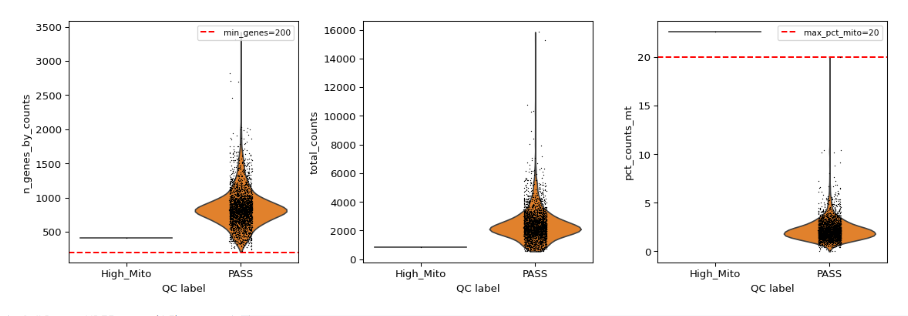
The node’s own QC plot. On the canvas, the node card shows the PASS / FAIL counts, a thumbnail, and the filters that will actually run.
- 01.Default prefixes are
MT-,RPS,RPLandHB; change them for mouse symbols or a different annotation.
Drag a threshold; the plots and the pass count move with it.
The per-cell metrics are shipped to the workspace once. From then on every change recomputes a pass mask in the browser and redraws three views — no backend round-trip, no waiting for the pipeline. The header keeps a running PASS / FAIL bar and the footer says how many cells will survive.
Histograms
One histogram per metric — genes per cell, total counts, % mito, % ribo, % Hb. Bars re-colour as PASS or FAIL around the threshold line as you move it.
Scatter
Total counts against genes per cell, drawn with WebGL. Passing cells are coloured by % mitochondrial reads; failing cells fade to a translucent red.
Knee plot
Barcode rank against UMI count with the knee marked — the view that shows where cells end and empty droplets begin when you loaded raw output.
Apply & Close
Writes the thresholds to the node as parameters and re-runs that node on its own. Re-run the workflow to carry the new cell set downstream.
Download the view
Save the current histograms, scatter or knee plot as PNG at 1×, 2× or 3× (96 / 192 / 288 dpi).
Export raw data
The numbers behind the plot leave as CSV with an .LLM_README.md that explains the columns — the same plot-source export every visualization workspace has.
Seven cell filters and one gene filter, each with its own switch.
Every filter has a checkbox and a threshold. The defaults below are what the node runs with when you never open the workspace; the backend, the workspace and the node card all read them from the same definition, so what the card lists is what will run.
| Filter | Parameter | Default | Threshold |
|---|---|---|---|
| Min genes per cell | min_genes | on | 200 |
| Max genes per cell | max_genes | off | 5,000 |
| Min counts per cell | min_counts | off | 500 |
| Max counts per cell | max_counts | off | 50,000 |
| Max % mitochondrial | max_pct_mito | on | 20 % |
| Max % ribosomal | max_pct_ribo | off | 50 % |
| Max % haemoglobin | max_pct_hb | off | 5 % |
| Min cells per genegene filter | min_cells | on | 3 |
Fixed in v0.24.0
Before v0.24.0 the workspace showed Max Genes and Max Counts ticked while the backend never applied them, and the card printed “No filters” while the run filtered on the backend defaults. Pressing Apply could switch on filters you had not asked for. All three surfaces now read the shared definition.
If you edited a Quality Control node through the workspace on an older version, check its filter list before trusting a downstream cell count — opening a saved .bioflow restores cached results and cannot warn you.
A starting point from your data’s own spread.
Each recommended threshold is the median of a metric plus or minus a multiple of its median absolute deviation — robust to the outliers that drag a mean around. Every threshold row carries a rec: button that applies just that value and switches the filter on; Auto-fill MAD Recommendations applies them all.
Standard mode
MAD × 5
The multiplier for filtered matrices, applied to every metric. The % mito, % ribo and % Hb recommendations are additionally capped so a clean dataset does not get a meaningless ceiling.
Raw Data Mode
MAD × 3
Loaded raw_feature_bc_matrix instead of the filtered one? Toggle Raw Data Mode in the workspace header. The multiplier drops to 3 by default and becomes editable (1–10 in steps of 0.5), because the long tail of empty droplets pulls the median.
Clip percentile
1 → [1, 99]
In Raw mode the plot axes are clipped to a percentile window so a handful of ultra-high-count droplets do not flatten the distribution. 1 keeps the middle 98 %; 0 turns clipping off. The node’s own plot and the workspace both obey it.
Tuning is live
Change MAD× and the rec: values are recomputed from the workspace’s own cell data at once; change Clip % and the axes re-clip. The values commit when you press Enter or leave the field, and the node quietly re-runs so its stored result matches what you see.
Start at the knee
Raw mode shows a one-time banner pointing at the Knee Plot tab. Decide the cell-versus-empty-droplet boundary there, then set Min Counts to match — the knee view keeps its threshold line synced to that filter.
The workspace belongs to one node. Other assays have their own QC nodes.
The QC Workspace is the Quality Control node’s editor: cells × genes count matrices from single-cell and spatial experiments. Spatial data also gets a second, smaller live workspace for cell density; bulk RNA-seq, methylation and ATAC-seq use dedicated QC nodes whose metrics are their own. Property panels and node cards label the axes in each assay’s units — cells × genes, samples × CpG probes, samples × genes, cells × peaks.
Quality Control
scRNA-seqSpatialFilter cells/genes by QC metrics. Unified node (replaces qcMetrics + qcVisualization).
QC Workspace — this page · 33 parameters
Spatial Density QC
SpatialFilter low-density spatial regions (Xenium edges, bubbles, control probe noise) using a grid.
Spatial Density QC Workspace — grid-size and min-cells sliders, live mask, Apply & Re-run · 4 parameters
Bulk QC
Bulk RNA-seqSample-level QC — library size, gene count, IQR-based outlier detection.
Parameters in the property panel · 4 parameters
Methyl QC
MethylationPer-sample / per-probe call rates with a built-in QC plot. "label" or "filter" mode.
Parameters in the property panel · 15 parameters
ATAC QC
ATAC-seqPer-cell QC — total fragments, peaks, FRIP score.
Parameters in the property panel · 4 parameters
Doublet Detection (Scrublet) is a separate node in the same preprocessing stage; it is not part of the QC Workspace. Node names, modality membership and parameter counts come from the catalog generated from the app.
Included with Beta Access
Tune your first QC on the PBMC tutorial.
Load the sample, run Quality Control, open the workspace, press Auto-fill, and watch the pass count settle before you commit a single threshold.