
From a finished workflow to a report in three steps.
Oreumics knows which nodes you ran, the parameters they used and the figures they produced. Press Report, answer one question in the chat panel, and an HTML or PDF with embedded figures, per-section interpretation and a Methods section is written from that record.
Auto-outline
- 1. Overview
- 2. Quality control
- 3. Normalization
- 4. Clustering
- 5. Marker genes
- 6. Methods
Analysis report · scRNA-seq
PBMC 3k — clustering & cell-type overview
Clustering
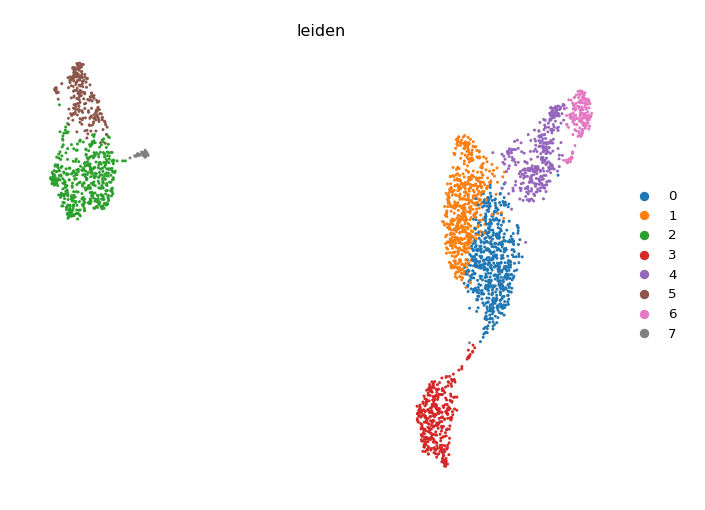
Leiden clustering at resolution 0.8 resolved 2,638 cells into
8 transcriptionally distinct populations, visualized below on the
UMAP embedding built from the top 50 principal components.
Methods — scanpy 1.9.6 · seed 0 · 8 nodes · reproducible
Outline from the graph
Sections and figures are detected from the completed nodes.
One emphasis question
Say what to highlight, or say “no” to go straight on.
Generate HTML or PDF
Sections stream in one by one; the file lands where you choose.
17 sections are recognised from the nodes that completed — plus three that come for free.
When you press Report, the app looks at every completed node in the focused workflow and maps its type to a section. Figures are filed the same way by plot type, and an outline card appears in the chat with one row per section. Functional activity (PROGENy, Hallmark, CollecTRI) is kept deliberately separate from pathway enrichment so an activity score is never described as if it were an enrichment p-value.
Data Overview
Load H5AD · Load 10X MTX · Load 10X H5 · Load CSV / TSV · Load Loom · Load Text
Quality Control & Preprocessing
Quality Control · Normalize · Log1p · Highly Variable Genes · Scale · Doublet Detection
Dimensionality Reduction
PCA · Neighbors · UMAP · t-SNE
Batch Correction
Harmony
Clustering Analysis
Clustering · Edit Clusters
Differential Expression Analysis
DEG Analysis
Cell Type Annotation
Auto Annotation · CellTypist Annotation · Cell Mapper · Annotation Concordance
Trajectory Analysis
PAGA · DPT · Diffusion Map · Draw Graph
CellRank: Cell Fate Analysis
CellRank Kernel · Cell Fate Analysis · Lineage Drivers · CellRank Visualization · Gene Trends
RNA Velocity Analysis
Load Velocyto Loom · Load STARsolo Velocity · RNA Velocity · Velocity Graph · Latent Time · Terminal States
Spatial Transcriptomics Analysis
Load Visium (SpaceRanger) · Load Visium HD · Load Xenium · Load MERSCOPE · Load CosMx · Load Transcripts · Add Coordinates · Spatial Density QC · Spatial Image Features · Spatial Viewer · Spatial Grouping · Spatial Neighbors · Nhood Enrichment · Spatial Graph Statistics · Co-Occurrence · Spatial Autocorrelation · Spatial Hotspot · Ripley · Spatial Domains (BANKSY) · Cellular Neighborhood · Spot Deconvolution (NNLS) · Spatial Ligand-Receptor · Spatial Visualization
Cell-Cell Communication
CellPhoneDB · CellPhoneDB Plot · LIANA · LIANA Plot · Ligand-Receptor
Pathway Enrichment Analysis
Pathway Enrichment · Pathway Visualization
Functional Activity Inference
PROGENy Activity · Hallmark Activity · CollecTRI TF Activity
Bulk RNA-seq Analysis
Load Count Matrix · Load featureCounts · Load Abundance (Kallisto/Salmon) · Bulk QC · Bulk Normalize · Filter Low Expressed · Differential Expression · GSEA / ORA · Bulk Visualization
DNA Methylation Analysis
Load IDAT · Load Methyl Beta Matrix · Methyl QC · Methyl Normalize · Methyl Filter · DMP Analysis · Multi-Group DM (3+ groups) · DMR Analysis · Methyl GOmeth · DMP Feature Enrichment · Methyl Visualization
ATAC-seq Analysis
Load Fragments · Load Peak Matrix · Load ATAC MEX · ATAC QC · Peak Calling · LSI · Chrom Accessibility · Motif Analysis · ATAC Visualization
Executive Summary — whenever at least one section was detected — written last, from the finished sections.
Methods — always, from the completed steps and the parameters they ran with.
AI Analysis Insights — when the workflow has an AI Chat history to draw on.
- Tick or untick any section; the Generate button counts what is left.
- Add a note to a section — it goes into that section’s prompt, so “compare with the 2019 atlas” lands where you meant it.
- Each section shows how many figures it owns; figures are filed by their plot type.
- Pick the model and choose HTML or PDF before you generate.
Analysis profile
The graph is also matched to one of ten analysis profiles — basic scRNA-seq, trajectory, velocity, spatial, integrated scRNA + spatial, batch-corrected, CellRank fate, bulk RNA-seq, methylation, ATAC-seq — which sets how much room each section gets (brief, medium or full) and what the Executive Summary should lead with.
“Before generating, is there anything you’d like to emphasize?”
Pressing Generate on the card does not generate yet. The chat asks one question, and your answer is read for analysis keywords — in English or Korean. A hit attaches your sentence to the matching section as a note; a sentence with no keyword becomes a note on every section, which is how “write it in Korean” or “keep it short” reach the whole report.
- Bilingual keywords. spatial / 공간, trajectory / 궤적, marker / 마커, methylation / 메틸레이션 and many more map to sections and to the nodes those sections need.
- Missing-analysis stop. Ask to emphasise spatial neighbourhoods on a workflow that never ran them and the chat names the node(s) to add and run, then stops instead of inventing a section.
- Skip words. no · none · skip · proceed · 아니오 · 없음 go straight to generation.
Detected emphasis
- •
neighborhood→ Spatial Transcriptomics Analysis (Nhood Enrichment ran — OK) - •
cluster→ Clustering Analysis - • Notes attached; starting report generation…
Sections stream in, written from the data rather than about it.
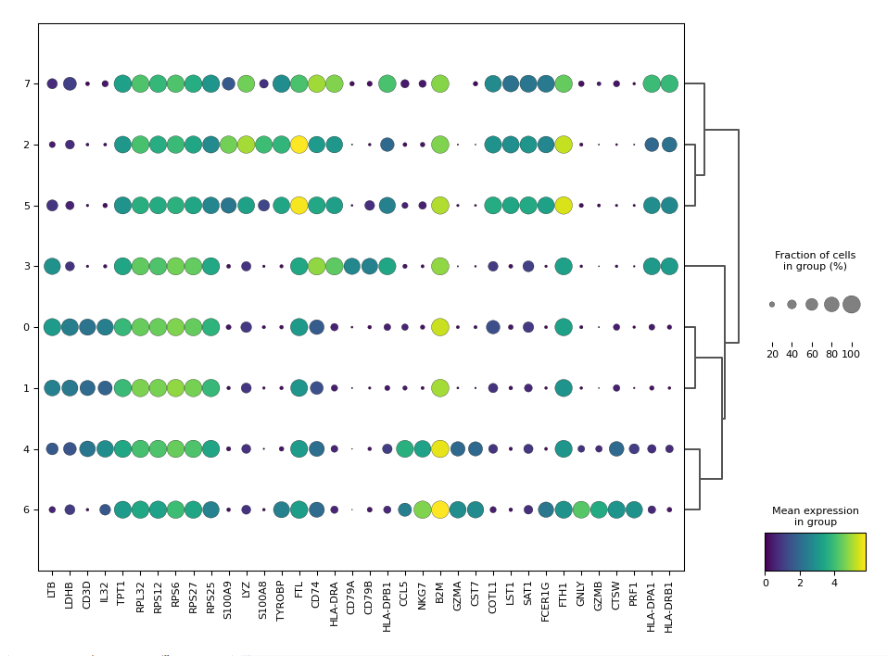
Progress is streamed back to the chat section by section. Before each one is written, an extractor reads the actual result — PCA variance ratios, the top genes per group, PAGA connectivity, velocity genes, Moran’s I, CellRank fate probabilities, activity scores, DMP counts — and hands it to the model with a section-specific interpretation guide. Sections are generated in dependency order, so the cell types inferred in the DEG section carry into trajectory, velocity and spatial text, and the Executive Summary is composed last from what was written.
- Live progress. each section reports as it starts, e.g. (3/9) Clustering Analysis.
- Methods. a formal, paper-style Methods section written from the completed steps and the parameters they actually ran with — not from memory.
- Language. Korean when your data labels or chat are Korean, English otherwise.
- HTML. a single self-contained file with a table of contents and the figures embedded, saved through a save dialog (oreumics_report_<date>.html).
- PDF. the same HTML printed to A4 by Electron’s own renderer with backgrounds kept and sections held together across page breaks, then a save dialog. If printing fails you still get the HTML.
Bring your own key
Report generation calls the model through the OpenAI API key you set in the app’s Settings; without one the run stops with a message. The outline card’s model picker defaults to gpt-5.6-terra. What leaves your machine is the outline, the extracted summaries and the figures — never a count matrix.
Every run keeps its parameters, so the Methods say what ran.
Methods panel, no report needed
The app’s Methods panel writes a Methods paragraph per node from the parameters as they stand — the same source the report’s Methods section starts from. Read it before you generate anything.
Provenance in the project
Each run records its parameters, and a project export carries run receipts. The report is a rendering of that record, not a substitute for it.
Honest about what is not there
A section is only offered when its nodes completed; an emphasis on an analysis you did not run stops the flow rather than filling the gap with prose.
Included with Beta Access · bring your own AI key
Generate your first report tonight.
Run a tutorial workflow, press Report, answer one question, and choose where the PDF goes.