
Lay out the figure plate next to the workflow that made it.
Pin a snapshot from any visualization workspace, drop it on a free-layout canvas in its own tab, label the panels, draw the arrows, crop what does not belong, and export a PNG at print resolution — without leaving the project file.
Gallery
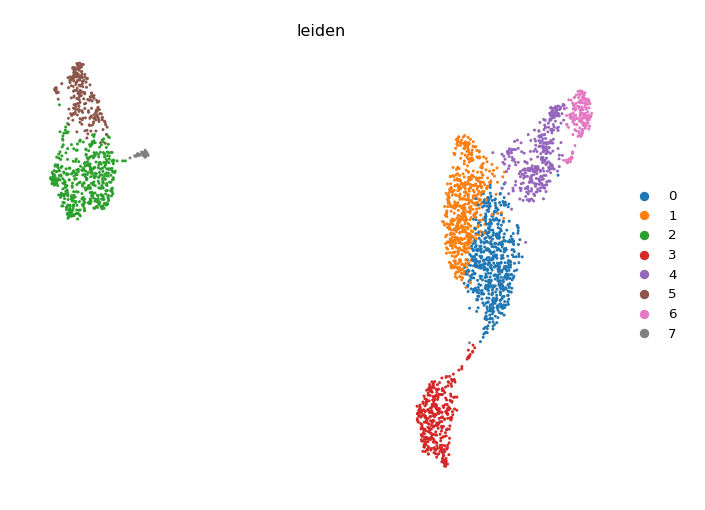
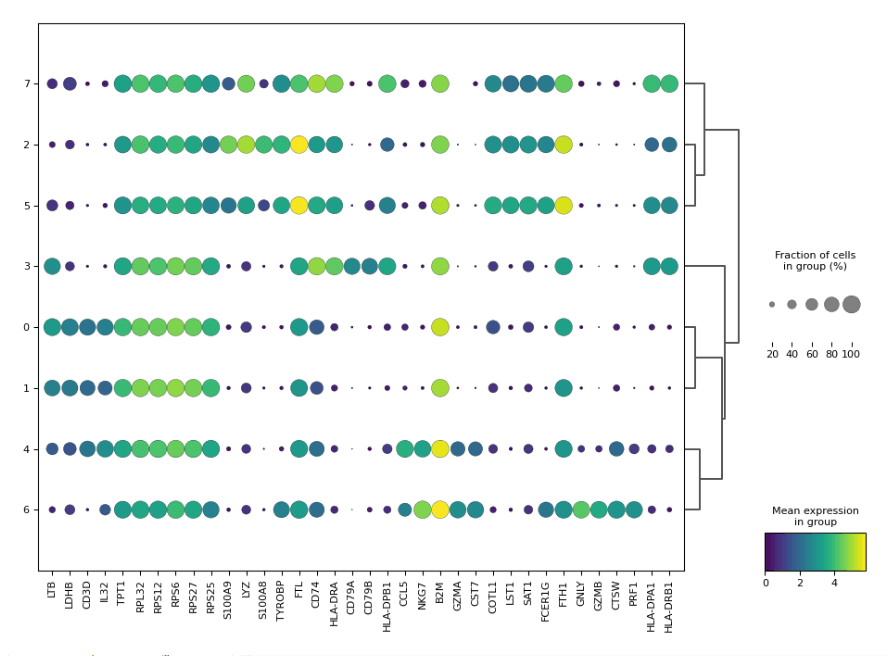
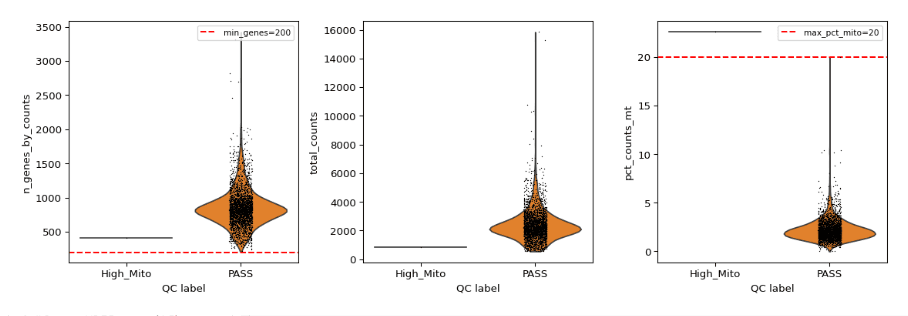
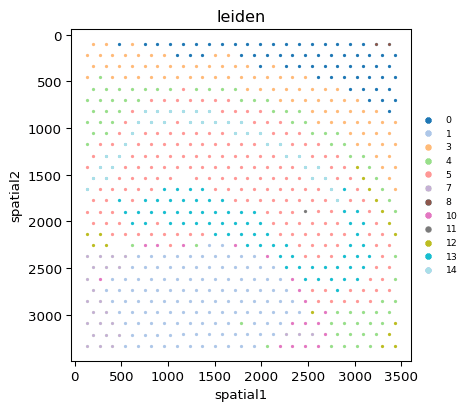
The gallery holds what you pinned.
Every plot starts in its Visualization or Embedding Workspace, where you tune the style. When it looks right, press Add Figure. A dialog lists every Figure Canvas that is open and offers to create a new one; pick a canvas and the snapshot lands in its gallery strip, carrying the label and the parameters it was rendered with.
- Drag a snapshot from the gallery onto the canvas, or double-click it to place it near the last item.
- Filter the strip by kind — Viz, Spatial, QC, Trajectory, Other — when a long session has pinned a lot.
- Pin the same node twice and the second snapshot is numbered, so two settings of one plot can sit side by side.
- A snapshot is a copy: re-running the node does not change a figure you already placed. Pin again when you want the new version.
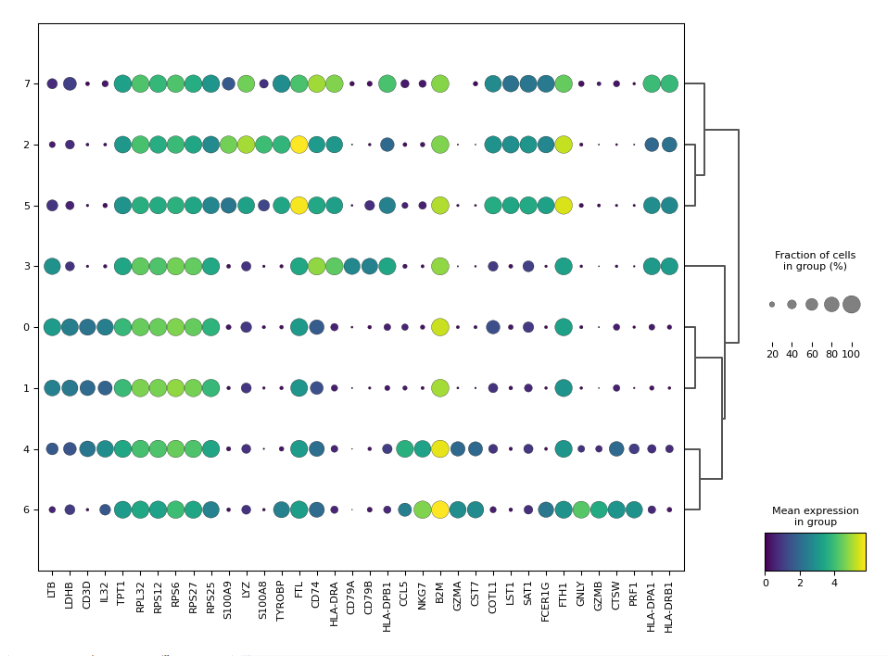
No grid, no template — a canvas you pan and zoom.
Place figures wherever the story needs them. The toolbar and the properties panel on the right carry the arrangement tools; the properties panel swaps in for the node panel whenever a Figure Canvas tab has focus.
Place and resize
Drag a snapshot anywhere. Resizing keeps the figure’s aspect ratio, so a panel never stretches by accident.
Multi-select, group, layer
Shift- or Ctrl-click to build a selection, group it, duplicate it, and move it up or down the layer order.
Align, space, match
Align a selection, set an even gap along either axis, or give several panels the same size.
Per-figure crop
Trim any edge of a placed figure. The crop is stored with the item and can be widened again later.
Lock, opacity, panel label
Lock a finished panel so it cannot drift, set its opacity, and stamp it A, B, C… in the corner you choose.
Undo and redo
Fifty steps in each direction, including drags. Zoom with the wheel, pan, or fit the whole plate to the view.
Text, arrows, lines and rectangles — still editable afterwards.
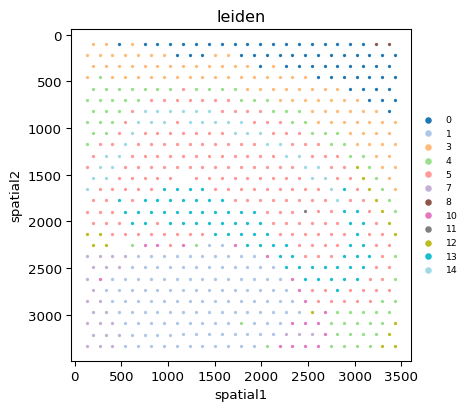
Pick a tool, click or drag on an empty part of the canvas, and the tool hands back to Select when the shape is done. Every annotation stays selectable: move it, restyle it from the properties panel, or delete it. Annotations are saved with the canvas and take part in undo.
Text
Click to place a label; edit the text and font size in the properties panel.
Arrow
Drag from a marker gene to the peak it belongs to. Stroke width is adjustable.
Line
A plain leader or divider between panels.
Rectangle
Frame a region of interest, filled or with a transparent fill.
One button, three scales, a transparent switch.
The canvas exports as a PNG rendered from the placed figures at the scale you pick. Vector output is not a canvas feature — download SVG or PDF from the Visualization Workspace of the individual plot instead.
Screen (3×)
Three times the on-screen pixel size — for slides and quick sharing.
Native
The figures’ source pixels, so nothing is upsampled. The default.
Print 300 dpi
Scaled for a 300 dpi print of the canvas at its on-screen physical size.
Transparent — added in v0.24.0
The Transparent switch drops the canvas background so a composed figure can sit on a coloured slide. Only the canvas is made transparent: each placed plot keeps its own background unless you turned on Transparent Background in that plot’s workspace before pinning it.
Keyboard shortcuts
Ctrl + ZCtrl + Shift + Z / Ctrl + YCtrl + C / VCtrl + AArrow keysShift + ArrowV / TDelete / BackspaceEscScroll wheelSeveral canvases, side by side with the workflow.
Its own tab, or several
Add a Figure Canvas from the tab bar as often as you like — one per figure, one per manuscript. Tabs can be dragged to an edge to split the window, so a canvas can sit beside the workflow that feeds it.
Saved with the project
Canvases, their gallery and every annotation are written into the .bioflow file. They survive replacing the workflow with a template or closing a workflow tab, and an edit marks the project unsaved like any other change.
The panel follows focus
Click into a canvas and the right-hand panel switches to figure properties — position, size, opacity, panel label, crop, layer — and back to node parameters when you return to the workflow.
The canvas arranges; the Visualization Workspace decides how each plot looks.
Colormaps, per-group colours, group renaming, legend placement, fonts, axes and figure size are set in the Visualization Workspace that every plot node opens — the same five sections on every plot: Plot, Titles & Labels, Axes, Legend, Figure & Export. Re-generate redraws the figure without re-running the analysis, and the same workspace downloads a single plot as PNG, SVG or PDF.
- Add Figure pins the current rendering to a canvas of your choice.
- Export raw data saves the numbers behind the plot as CSV with an .LLM_README.md that explains each column.
Colormap
Points
Palette (categorical)
Labels
Frame
Export
The Visualization Workspace, not the canvas: this is where a plot is styled and downloaded as PNG, SVG or PDF before it is pinned.
Included with Beta Access
Lay out your next paper’s Figure 1 where the data is.
Start from a tutorial workflow, pin the UMAP and the marker plot, and export the plate at 300 dpi before the day is out.