
●Single-cell · Spatial · ATAC · Bulk · Methylation
Describe the analysis. Watch it build. Edit any step.
Oreumics is the AI copilot for single-cell, spatial & multi-omics bioinformatics. Say what you want in plain language — it assembles a visual pipeline of 119 analysis nodes1, runs it on your machine2, and lets you open any node to tune it. Publication-ready figures and reports, without a line of code.
- 119
- nodes
- 5
- modalities
- 22
- loaders
- 100%
- local
pbmc_3k.h5ad
min_genes: 200 · MT < 5%
target_sum: 1e4
n_neighbors: 15
resolution: 0.5
pbmc_3k.h5ad
2,700 cells · 32,738 genes
min_genes: 200 · MT < 5%
2,638 cells pass QC
target_sum: 1e4
Log-normalized ✓
n_neighbors: 15
2D embedding ready
resolution: 0.5
8 clusters · leiden
UMAP · leiden
2,638 cells · 8 clusters
Nodes appear, wire together, then run — ending in a UMAP. The desktop app and this site share one design system.
- 01.The AI Copilot does not just answer questions. It returns an Action Plan — a structured list of node insertions, parameter updates, and edge changes — that you stage with one click. See §02.
- 02.Analysis runs 100% locally on your machine. The optional AI Copilot sends only lightweight metadata — node names, parameters, and small result summaries, never your raw data — to your chosen LLM provider, and can be turned off entirely.
From a sentence to a result — in three moves.
The AI proposes, the canvas makes it visible, and you stay in control. Ask in plain language, watch the pipeline build node by node, then open any step to tune it — nothing hidden, nothing you can’t change.
Describe it in plain language
The AI answers with a staged Action Plan — add nodes, wire them, set parameters — that you approve with one click.
Watch the pipeline build
Every step lands as a visible node on the canvas, wired in order. Nothing runs in a black box.
Open any node and tune it
Change a parameter and only downstream re-runs — deterministic, logged, and reproducible.
Output
“The supplement writes itself.”
Methods, figures, statistics, and AI-written interpretation — exported as HTML or PDF, ready for the supplementary materials.
Oreumics
scRNA-seq Analysis Report
PBMC 3k Dataset · February 25, 2026
🔬 Executive Summary
Analysis of 2,638 high-quality cells following stringent QC identified 8 transcriptionally distinct populations via Leiden clustering (resolution=0.5). T cell clusters (C3, C7) are characterized by high CD3D and CD3E expression, with C7 corresponding to CD8+ cytotoxic T cells (GZMB↑, PRF1↑). A monocyte cluster (C4) demonstrates elevated LYZ and CST3. B cells form a compact cluster (C5) defined by MS4A1.
Contents
🔵 Clustering Analysis
Fig. 1: UMAP projection
Leiden clustering produced 8 populations ranging from 89 to 480 cells. Cluster C1 (n=480) represents CD4+ helper T cells, while C3 (n=312) are NK cells. The separation in UMAP space reflects distinct transcriptional programs confirmed by differential expression analysis (p < 0.001).
Generated by Oreumics · Feb 25, 2026
The actual screens — not stock art.
Chat builds and edits the graph, your own AI assistant can drive it over MCP, and every figure is tuned in a live workspace. Here is what that looks like.
01 · AI Chat
Chat that knows your data.
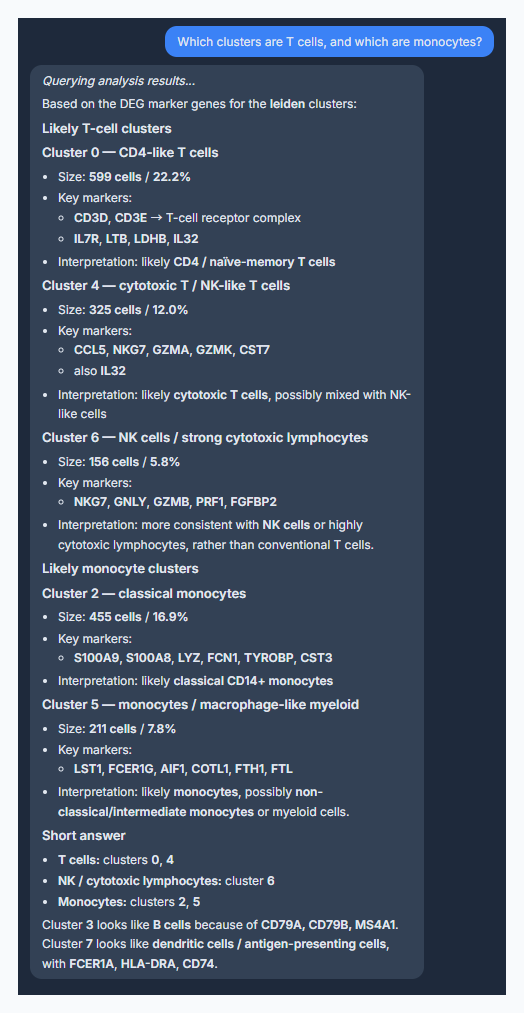
Ask in plain language and the AI answers from your actual analysis — it reads the clusters and marker genes and tells you which are T cells, which are monocytes. It can also add nodes and edit parameters, staged as a diff you approve with one click.
02 · Action Plan
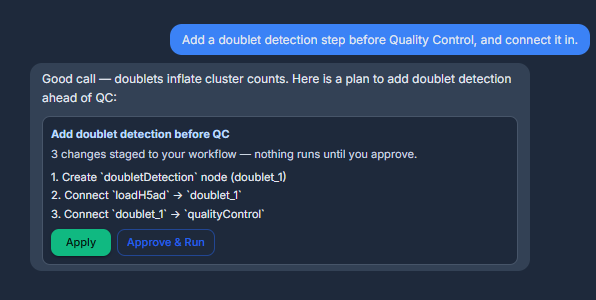
Ask for a change — approve the diff.
The AI stages every edit as an Action Plan — add a node, wire it in, tune parameters. Nothing touches your workflow until you press Apply.
PreviewOr Approve & Run — the agent applies it, runs it, and verifies each step, with one-click undo.
03 · MCP
PreviewOr drive it from your own AI.
Connect Claude Desktop, Codex, or Claude Code over MCP. They call Oreumics’ tools on your machine — running nodes, reading results — and your data never leaves the device.
04 · Figure workspace
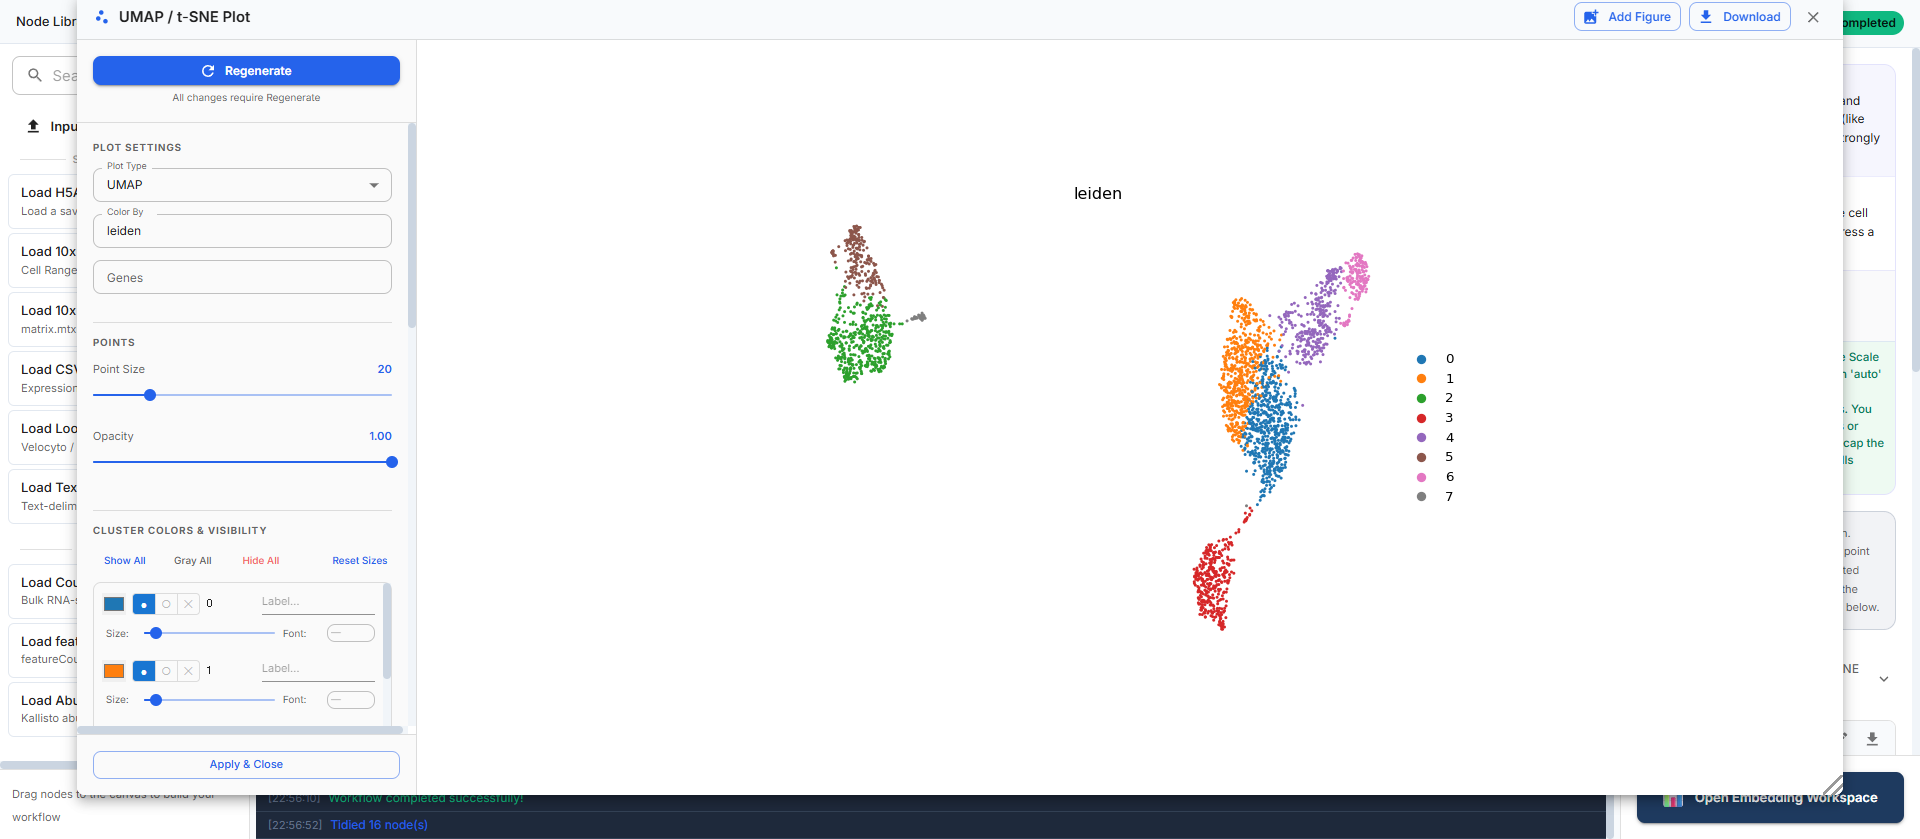
Tune every figure, live.
Recolour, resize, relabel, swap colormaps — in an interactive workspace. Every tweak is saved back to the node, so the figure stays reproducible.
Tell it the outcome — it finds the settings.
Say “cluster this until I get exactly 20 populations.” The agent picks a resolution, runs clustering, counts the result, and re-plans — looping until it lands on the number. You approve once; it stops at the goal, a token budget, or your Stop button.
- ✓Verified, not claimed — every iteration is checked on the canvas — the cluster count is read back from your data, not asserted in chat.
- ✓It can’t run away — a finite token and step budget caps the loop; it stops at the goal or the budget, whichever comes first.
- ✓Fully reversible — one-click Undo reverts the whole run, and Stop halts it mid-loop.
clusters found
—
Illustrative animation — the goal-seeking loop itself is in the shipping app.
Full scanpy pipeline, visually.
From raw counts to publication-ready figures. Each step is a node you can connect, configure, and re-run instantly — no kernel restart, no boilerplate.
- Quality control & doublet removal
- Normalisation, HVG, scaling
- PCA, UMAP, t-SNE
- Leiden / Louvain clustering
- Trajectory analysis (scVelo, PAGA)
- Harmony batch correction
Pipeline · PBMC
- 01Load H5AD2,700 cells
- 02Scrublet62 doublets removed
- 03QC Filter2,638 cells pass
- 04Normalizelog-normalised
- 05HVG select2,000 genes
- 06PCA50 components
- 07UMAP2D embedding
- 08Clustering8 clusters
Figures generated by Oreumics
Fig. 1 — 3
Fig. 1 · UMAP
UMAP · Cell clusters
2,638 cells · leiden clustering
Fig. 2 · Violin
Violin · CD3D expression
T cell marker expression
Fig. 3 · Dot plot
Dot plot · Marker genes
Top markers per cluster
Decode tissue architecture.
The full Squidpy stack on a visual canvas. Understand how cells are organised in tissue — and which molecules drive it. Compatible with 10x Visium, MERFISH, Xenium, Slide-seq.
- Spatial neighbours graph
- Neighbourhood enrichment
- Spatially variable genes
- Co-occurrence & Ripley statistics
- CellPhoneDB ligand–receptor
- Spatial scatter & domain plots
Pipeline · Visium
- 01Read Visium3,460 spots
- 02Spatial neighborsn_rings: 1
- 03Nhood enrichmentp < 0.001
- 04Spatial SVGs243 genes
- 05Spatial scattertissue map
Spatial Scatter · 10x Visium
One canvas, every modality.
Bulk RNA-seq
9 nodesfeatureCounts, STAR, Kallisto or Salmon in; PyDESeq2 differential expression, GSEA, volcano and MA plots, sample-distance heatmaps out.
DNA methylation
12 nodesIllumina IDAT or beta matrices. Raw-signal QC, DMP/DMR, CpG-bias-corrected GOmeth, and local cCRE/BED enrichment.
ATAC-seq
9 nodesFragments or peak matrices. ATAC QC, peak calling, LSI, differential accessibility, motif enrichment via pyJASPAR.
Pathways & activity
5 nodesEnrichr ORA and gseapy GSEA for gene lists; PROGENy, Hallmark and CollecTRI activity scores per cell or sample.
Cell–cell communication
4 nodesCellPhoneDB + LIANA consensus ligand–receptor analysis. Dot plots, heatmaps, chord networks.
● Unique to Oreumics
The only no-code path for methylation arrays.
Load raw IDAT / 450K / EPIC / EPIC v2, normalize, call DMPs & DMRs, and run GOmeth pathway enrichment — on a canvas. No R, no scripting, no local toolchain to wrangle.
The pipeline · 12 nodes
- 01Load IDAT
- 02Methyl QC
- 03Quantile normalize
- 04DMP Analysis
- 05DMP feature enrichment
- 06Methyl GOmeth
Everything a researcher needs — nothing more.
“Publication-quality analysis without writing a single line of code.”
Node-based workflow
Drag, drop, connect. No code, no Jupyter, no kernel restarts.
AI copilot built in
Chat proposes editable action plans; open any node to tune it. Bring your own OpenAI, Claude, or Gemini key.
Publication-grade figures
UMAP, violin, dotplot, spatial scatter, volcano — exported as high-res PNG.
Runs 100% locally
Your AnnData never leaves the machine. Scanpy + Squidpy under the hood.
DAG execution engine
Parallel branches, downstream cache invalidation, real-time progress.
Auto-updating desktop app
New features ship over the air. Always on the latest build.
And an AI copilot that understands every one of them.
Read the articleSubscribe to the beta
Start your analysis— today.
Small labs get three bad doors: upload to someone’s cloud, burn a grad student for six months, or trust a black-box AI. Oreumics is the fourth — the bioinformatics core your lab can own.
Free during beta · no credit card · local execution · admin-reviewed access.