
IDAT to DMP, DMR and GOmeth — Illumina arrays without R.
Load IDAT pairs with the mepylome engine — 450K / EPIC v1 / EPIC v2 / Mouse, auto-detected — choosing Illumina, NOOB, SWAN or raw signal preprocessing, or start from a vendor beta matrix. Methyl QC draws detection-p, intensity, control-strip, SNP-heatmap and call-rate plots; then quantile normalisation, SNP / sex-chromosome / cross-reactive filtering, DMP (Welch or moderated t), multi-group F-test, bumphunter-style DMR, cCRE / BED feature enrichment and CpG-bias-corrected GOmeth — 19 nodes, 10 plot types.
In the Methylation view
- Nodes in this view
- 19
- Loaders
- 3
- Templates
- 4
- Plot types
- 10
8 pipeline stages
IDAT · Methyl Beta Matrix · H5AD
4 need a Resource Center install
across the visualization nodes in this view
Counted from the app’s v0.25 Node Library view, not typed by hand.
EPIC v2 · prep illumina
samples × probes
call rate ≥ 0.95
QC plots drawn
quantile
normalized_beta
SNP · sex chr · cross-reactive
probes kept
sample_sheet.csv
group attached
case vs control · |Δβ| ≥ 0.1
DMPs called
min 3 probes · gap 1 kb
regions
CpG-bias corrected
terms ranked
A Methylation pipeline on the Oreumics canvas — drag, connect, run. Illustration; parameters are examples.
What it produces
Result capture
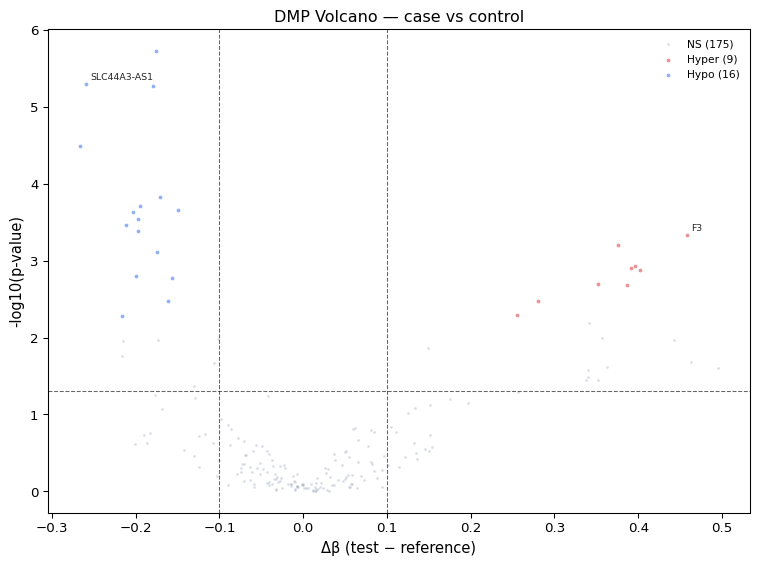
Methyl Visualization, volcano plot type — Δβ against −log10 p-value from DMP Analysis, hyper- and hypo-methylated probes highlighted.
What you can drag in.
.idat_Grn + _Red pairs, plain or gzipped, scanned recursively. Array type auto-detected or set explicitly; EPIC v2 replicate probes collapsed.
.csvPre-processed beta values as CSV / TSV / TXT (.gz OK). Orientation is auto-detected, vendor 0–100 percentages divided down, EPIC v2 replicates collapsed.
.csvPhenotype, batch and covariates join onto samples with Merge Cell Meta (auto-matched, deterministic); Load IDAT also accepts an optional vendor sample sheet.
Bisulfite-sequencing coverage files (Bismark .cov, methylKit, bedGraph) are not supported — convert them to a beta matrix upstream. SWAN preprocessing is non-deterministic by construction; the other prep modes reproduce exactly.
A canonical Methylation pipeline.
The steps below are the story; the full stage-by-stage node list follows in section 04.
- 01
Load with raw-signal preprocessing
Load IDAT reads the pairs with mepylome and applies the chosen prep — Illumina scaling (default), NOOB out-of-band background correction, SWAN, or raw — before computing beta and M-values. Manifests and annotation are installed through the Resource Center, never downloaded mid-run. No IDATs? Load Methyl Beta takes a vendor matrix.
- 02
Attach the phenotype
Merge Cell Meta joins the sample sheet; group, case / control, age and batch become obs columns that DMP picks from a dropdown. Define Groups builds labels from rules when there is no sheet.
- 03
QC on the raw signal
Methyl QC reports sample and probe call rates and draws the QC plots — detection p-values, intensities, the control strip (bisulfite conversion), the SNP heatmap for sample identity — before anything is dropped, in label or filter mode.
Nodes:Methyl QC - 04
Normalize and filter
Methyl Normalize applies NaN-aware between-array quantile normalisation in beta space, or none. Methyl Filter removes SNP-associated, sex-chromosome, cross-reactive and low-call-rate probes — required before DMP.
- 05
Differential methylation
DMP Analysis tests two groups with Welch’s or a limma-style moderated t-test on M-values, with BH FDR and a |Δβ| threshold. Multi-Group DM runs an omnibus moderated F-test plus per-group contrasts for three or more groups.
- 06
Regions and loci
DMR Analysis groups adjacent same-direction DMPs within a maximum gap (bumphunter-style); the DMR Locus Plot shows per-sample beta and group means across one region, genome-browser style.
- 07
Enrichment
DMP Feature Enrichment tests hyper / hypo DMPs against a local BED or cached ENCODE cCRE classes with Fisher + BH and a forest plot, failing closed on a genome-build mismatch. Methyl GOmeth corrects the CpG-density bias of plain gene-set tests, in all, hyper, hypo or split direction.
- 08
Plots
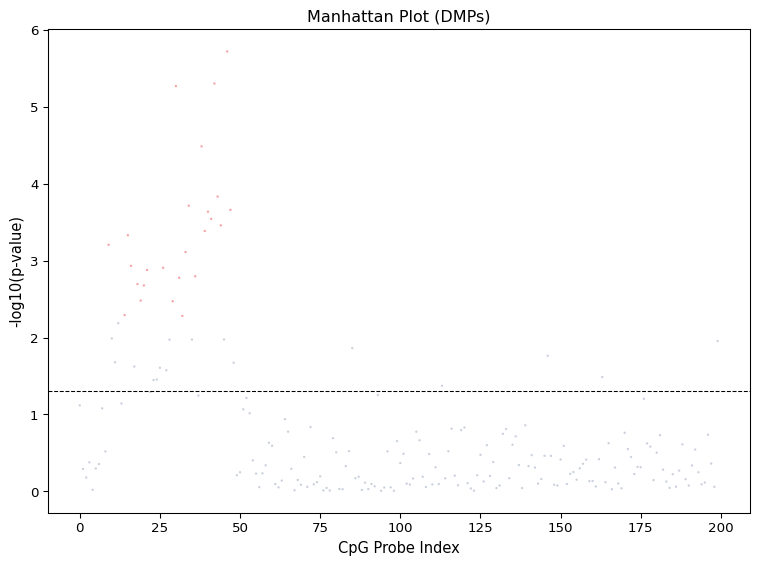
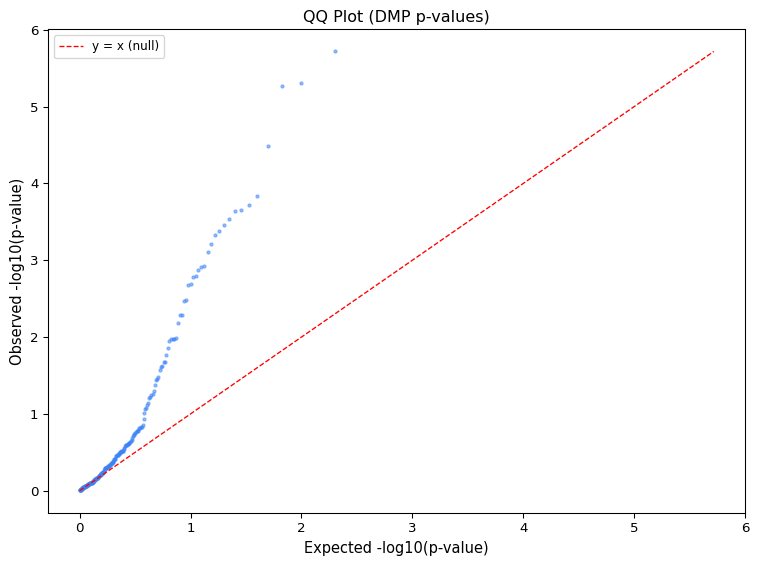
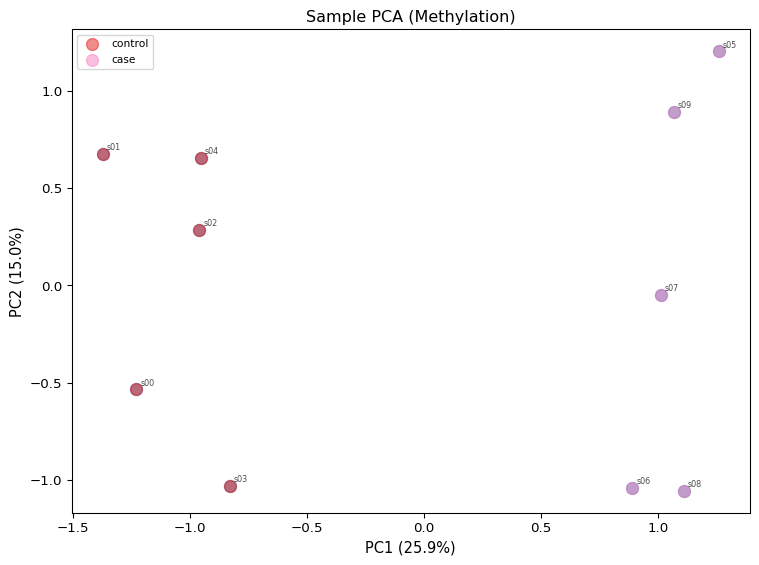
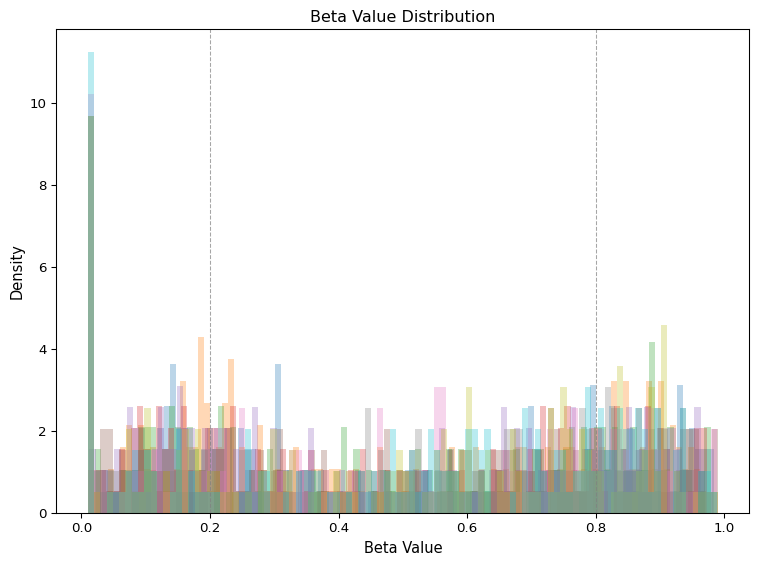
Methyl Visualization draws Manhattan, QQ, volcano, heatmap, sample PCA, beta distributions, beta-by-probe-type and annotation distributions — each editable in the Visualization Workspace.
Nodes:Methyl Visualization
Every node, in pipeline order.
The app’s Node Library is modality-first: pick dna methylation (illumina array) and it shows these 19 nodes grouped into the 8 stages below. Shared nodes such as Quality Control or Merge Cell Meta appear in more than one view.
Stage 01
Load Data
3 nodes
Stage 02
Sample Sheet & Groups
2 nodes
Stage 03
QC & Filtering
2 nodes
Stage 04
Normalization
1 nodes
Stage 05
Differential Methylation
3 nodes
Stage 06
Enrichment
2 nodes
Stage 07
Plots
2 nodes
Also available
Utilities & Export
4 nodes · collapsed by default in the app
Pre-wired pipelines — open, point at data, run.
Templates open from the Templates dialog with sensible defaults already set. Those marked below include a node whose database, model or manifest must be installed in the Resource Center first — every other node runs, and the gated one stops until it is installed. A run never downloads.
Methylation — Full Pipeline (IDAT to DMP / DMR)
22 nodesLoad IDAT → Methyl QC → Methyl Normalize → Methyl Visualization → Methyl Filter → Merge Cell Meta → DMP Analysis → DMR Analysis → Methyl DMR Locus Plot → Methyl GOmeth
Needs Resource Center install · Load IDAT, Methyl GOmethMethylation — Full Pipeline (Beta Matrix to DMP / DMR, EPIC v2)
15 nodesLoad Methyl Beta Matrix → Methyl Filter → Methyl Visualization → Merge Cell Meta → DMP Analysis → DMR Analysis → Methyl DMR Locus Plot → Methyl GOmeth
Needs Resource Center install · Load Methyl Beta Matrix, Methyl GOmethMethylation — Visual EDA (no phenotype required)
4 nodesLoad Methyl Beta Matrix → Methyl Visualization
Needs Resource Center install · Load Methyl Beta MatrixMethylation — Pathway Discovery (Volcano + GOmeth)
8 nodesLoad Methyl Beta Matrix → Methyl Filter → Merge Cell Meta → DMP Analysis → Methyl Visualization → Methyl GOmeth
Needs Resource Center install · Load Methyl Beta Matrix, Methyl GOmethSample data the templates point at
The 4 methylation templates ship without a bundled sample path: point Load IDAT at an IDAT folder or Load Methyl Beta at a beta matrix. The Sample data page lists a public 450K beta matrix you can download for the beta-matrix templates.
All sample datasets, with sourcesWhat sets it apart
IDAT to GOmeth without leaving the canvas
One node graph carries raw IDATs through preprocessing, raw-signal QC, normalisation, filtering, DMP / DMR, locus plots and enrichment — with no hand-off to R in the middle.
QC on the signal, not only the beta
Detection p-values, channel intensities, the control strip and the SNP identity heatmap are drawn from the raw signal, so a failed bisulfite conversion or a swapped sample shows up before a single DMP is called.
Honest statistics
Normalisation is quantile or none; raw-signal NOOB / SWAN happen where they belong, in Load IDAT. DMP results, the DMR merge and the feature-enrichment background all come from the same tested probe universe, and GOmeth corrects the CpG-density bias.
Local by design
IDATs and beta matrices stay on your machine. Manifests, annotation and cCRE tables are pinned, checksummed installs in the Resource Center.
Figures from this pipeline
4 captures
Walk it step by step.
End matter
Start with Methylation today.
Free during the beta with an admin-issued Beta Access ticket. Windows 10/11, 64-bit. Runs locally; sign in at each launch.