
Harmony Integration & Doublet Screening Tutorial
Detect and flag doublets in single-sample data, then integrate multiple batches with Harmony to produce a batch-corrected UMAP embedding.
What you'll learn
- Detect doublets in a single sample using simulation-based scoring (Scrublet) and decide a sensible threshold from the score distribution.
- Merge two scRNA-seq batches into one AnnData with a
batchobs column, then run Harmony to create a batch-corrected PCA embedding. - Verify integration quality — confirm clusters mix cells from both batches, not separate by batch of origin.
Prerequisites
- • Oreumics installed (install guide).
- • PBMC tutorial completed — this tutorial assumes the standard preprocessing chain is familiar.
- • Doublet, batch effect, and theta are defined in the glossary at the bottom.
- • Sample data:
sampledata/scrna/pbmc3k_raw.h5ad— pre-bundled. Loaded twice as "pbmc_a" and "pbmc_b" to simulate a two-batch experiment. Both sections match the shipped templates scRNA Doublet Screening and scRNA Harmony Integration.
Dataset
Sample file (pre-packaged)
sampledata/scrna/pbmc3k_raw.h5ad— 2,700 cells × 32,738 genes · integer counts · already included in OreumicsWhat it is
Peripheral blood mononuclear cells (PBMCs) from a healthy human donor, sequenced on a 10x Chromium v2 chip. For the Harmony integration section, the same file is loaded twice and treated as two separate batches to simulate a multi-sample experiment.
scRNA Doublet Screening
Doublets are a major source of false cell populations in scRNA-seq. Oreumics uses Scrublet, a simulation-based approach: it artificially creates synthetic doublets by averaging pairs of real cells, then scores each real cell by how much it resembles those synthetic doublets. Real cells that look like doublets are flagged.
Pipeline
Key Concept — Doublet Rate
10x Genomics reports approximately 0.8% doublet rate per 1,000 cells recovered. For a typical 5,000-cell run, expect roughly 4% doublets. The default expected_doublet_rate of 0.06 (6%) is a safe upper-bound for most 10x experiments. Setting it too low causes missed doublets; too high causes false positives.
Load the PBMC 3k counts before any filtering — doublet detection should always run on unfiltered data so the classifier has access to all cell profiles.
file_pathsampledata/scrna/pbmc3k_raw.h5adWhat you'll see
2,700 cells × 32,738 genes loaded. Raw count matrix stored in adata.X.
Compute per-cell quality metrics without removing any cells (mode: label). Adds n_genes_by_counts, total_counts, pct_counts_mt, pct_counts_ribo, and pct_counts_hb to obs. Running QC first lets you compare doublet scores against the QC metrics later — you can filter after labeling.
modelabelmito_prefixMT-human mitochondrial genesribo_prefixRPS,RPLribosomal protein geneshb_prefixHBhemoglobin genesWhat you'll see
adata.obs now contains the QC metric columns plus a QC_label. No cells are removed at this step.
With mode: label, each cell receives a doublet_score (0–1) and a predicted_doublet flag (True/False), but no cells are removed. Leaving threshold empty lets Scrublet choose the cutoff automatically from the score distribution. n_prin_comps: 30 sets how many PCs are used internally to simulate doublets.
modelabelexpected_doublet_rate0.06thresholdnullauto-detect thresholdn_prin_comps30What you'll see
doublet_score and predicted_doublet columns added to adata.obs. The node card shows the exact count of predicted doublets.
Tip
To remove the flagged cells, either re-run Doublet Detection with mode: filter, or add a Subset Data node (filter_type: cells, condition predicted_doublet == False) so the decision stays explicit on the canvas. Alternatively keep doublets for now and re-examine them after clustering — doublets often appear as small clusters in UMAP that co-express markers from two different cell types.
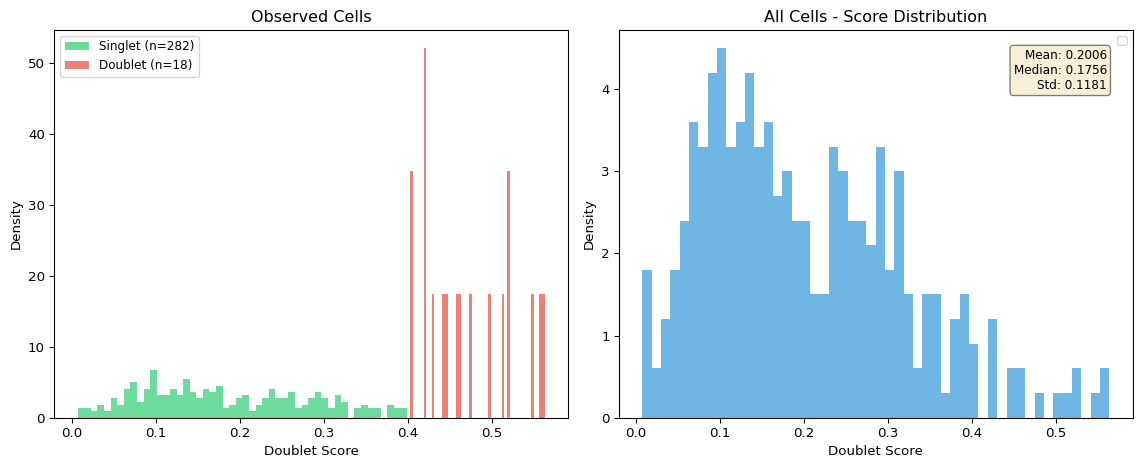
Renders a histogram of doublet scores across all cells. The x-axis is doublet score (0 = definitely singlet, 1 = definitely doublet); the y-axis is cell count. A vertical dashed line shows the automatic threshold. Cells to the right of the threshold are flagged as doublets. The template adds a second node with plot_type: overview.
plot_typehistogramshow_thresholdtrueWhat you'll see
A large peak near 0 (singlets) with a smaller tail toward higher scores (predicted doublets). The automatic threshold line sits between the two. The exact number flagged is reported on the Doublet Detection node card.
scRNA Harmony Batch Integration
Harmony is a fast and widely used method for batch integration. It operates in PCA space: it iteratively adjusts PCA embeddings so that cells from different batches overlap if they have similar transcriptional profiles. Crucially, Harmony does not modify the count matrix — it adds a corrected embedding (X_pca_harmony) alongside the original X_pca.
Pipeline (scroll →)
Key Concept — Harmony theta parameter
Theta (θ) controls the diversity penalty — how strongly Harmony forces batch mixing.
theta: 0No correction — identical to regular PCAtheta: 2Moderate correction — the node default and recommended starting pointtheta: 4+Strong correction — use when batches are very differentIf biological differences are lost after integration (e.g., all cell types collapse together), reduce theta. If batches are still visibly separated, increase theta.
Load the first batch. Set file_path to sampledata/scrna/pbmc3k_raw.h5ad. In a real experiment this would be a sample from day 1, lab A, or donor A. Place this node on the canvas alongside Load H5AD (B) — both outputs connect to Merge Data.
file_pathsampledata/scrna/pbmc3k_raw.h5adLoad the second batch. Set file_path to sampledata/scrna/pbmc3k_raw.h5ad again (same file). This simulates a second batch — in practice, use a different sample file. Both nodes should be on the canvas simultaneously, with each output connected to Merge Data.
file_pathsampledata/scrna/pbmc3k_raw.h5adConcatenate both datasets into one AnnData object. batch_key specifies the obs column that will store batch identity. The label for each input is entered on its own card in the node (prefilled from the source node names): the first connected input becomes pbmc_a, the second pbmc_b. join: inner keeps only genes present in both datasets (the node default is outer). The live preview shows the merged shape before you run.
batch_keybatchbatch_labels_listpbmc_a, pbmc_bone label per input cardjoininnerWhat you'll see
5,400 cells total (2,700 × 2). Each cell has adata.obs["batch"] set to pbmc_a or pbmc_b.
Scale every cell so that the total count equals target_sum, removing library-size differences. Normalization is performed on all cells together after merging, so the scale is consistent across batches. save_counts keeps the raw counts in layers["counts"].
target_sum10000save_countstrueApply log(x + 1) transformation. This is identical to the single-sample preprocessing workflow.
basenullnatural log (default)save_normalizedtrueSelect the 2,000 most variable genes. Setting batch_key is critical — it instructs Scanpy to select HVGs that are highly variable within each batch independently, then combine them. This prevents batch-specific artifacts from being selected as HVGs simply because they vary between batches.
n_top_genes2000flavorseuratbatch_keybatchselect HVGs within each batchWhat you'll see
2,000 genes flagged as highly_variable: True in adata.var. HVGs reflect within-batch variance, not batch-to-batch differences.
Standardize each gene to zero mean and unit variance, capped at max_value. hvg_only (default true) keeps only the HVGs in X and saves the full log-normalized matrix to adata.raw for DEG Analysis and the plots.
max_value10Compute PCA on the merged data. At this stage, batches are NOT corrected — if you ran UMAP directly from X_pca you would see two separate clouds, one per batch (with real data; the demo loads the same file twice, so the clouds coincide). This is expected and useful as a before-correction reference.
n_comps50use_highly_variabletrueHarmony reads the X_pca embedding and the batch labels from obs.batch, then iteratively adjusts cell embeddings to maximize batch mixing. The result is stored in obsm.X_pca_harmony — the original X_pca is untouched. theta: 2.0 provides moderate correction, appropriate for samples from the same tissue type.
batch_keybatchbasisX_pcaadjusted_basisX_pca_harmonytheta2.0moderate diversity penaltyWhat you'll see
adata.obsm["X_pca_harmony"] added. The original X_pca is preserved unchanged.
Tip
The Harmony node is the only addition to a standard scRNA-seq pipeline. Everything before it is identical to a single-sample workflow.
This is the most important post-Harmony step: you must point use_rep to X_pca_harmony (the corrected embedding), NOT X_pca. Using the uncorrected X_pca here would negate the Harmony correction for all downstream steps including UMAP and clustering.
n_neighbors15use_repX_pca_harmonymust use corrected embeddingComputes the 2D UMAP embedding from the Harmony-corrected neighbor graph. min_dist: 0.3 produces compact clusters while preserving global structure.
min_dist0.3Color cells by their batch label (pbmc_a vs pbmc_b). If integration was successful, cells from both batches should be interleaved within every cluster — you should not see batch-specific regions in the UMAP. The template also runs Clustering after UMAP and a second Embedding Plot colored by leiden.
plot_typeumapcolor_bybatchWhat you'll see
After Harmony, the two batch clouds merge into shared clusters. When colored by batch, cells from both batches appear interleaved in every cluster. The same major PBMC populations — T cells, B cells, NK cells, Monocytes — appear as before, but now both batches contribute to each cluster.
Tip
Run Embedding Plot twice: once with color_by: batch (verify mixing) and once with color_by: leiden (verify cluster coherence). Good integration shows clusters that are tight, with batch labels scattered within each cluster.
Expected Results
- • Doublet histogram: a dominant singlet peak near 0 with a small high-score tail; the exact number of predicted doublets is shown on the node card
- • Doublet threshold: automatically placed between the singlet peak and the doublet shoulder
- • Merged dataset: 5,400 cells total (2,700 × 2), each batch labeled pbmc_a or pbmc_b in obs.batch
- • Highly Variable Genes with batch_key: selects genes variable across both batches; avoids batch-specific artifact genes
- • Pre-Harmony UMAP (X_pca): with real batches, two visually distinct clouds separated by batch origin
- • Post-Harmony UMAP (X_pca_harmony): batches merge into shared clusters; coloring by batch shows even mixing
- • Leiden clustering after Harmony recovers the same major PBMC populations as the single-sample tutorial
Integration Tips
Run QC per sample before merging
Add a Quality Control node after each Load H5AD node and before Merge Data. Filtering low-quality cells per-sample prevents one bad sample from contaminating the merged dataset. The Merge Data node concatenates already-filtered AnnData objects.
Harmony is the integration method Oreumics ships
Harmony is fast and suitable for most experiments with mild-to-moderate batch effects (same tissue, different donors or time points). Other methods such as scVI or BBKNN are not available as nodes; if you need them, run them outside Oreumics and load the resulting H5AD, then point Neighbors at the stored embedding with use_rep.
Going Further
- For experiments with more than 2 samples, work through the dedicated multi-sample integration tutorial — covers join modes, per-sample QC, and integration quality checks.
- After integration, rank DEGs per cluster using the DEG Analysis + Marker Visualization pattern from the PBMC tutorial.
- Run pathway enrichment on those markers via the Pathway tutorial — biology-level interpretation per integrated cluster.
Glossary
- Doublet
- A barcode in a 10x library that captured 2 cells instead of 1. Doublets create false "hybrid" cell populations — e.g., a cluster expressing both T-cell and B-cell markers. ~0.8% per 1,000 recovered cells.
- Batch effect
- Technical variation between samples that comes from sequencing run, library prep day, donor identity, etc. Without correction, the first PCs separate batch instead of biology.
- Harmony
- A fast batch-correction method that adjusts PCA coordinates iteratively to maximize batch mixing while preserving cell-type clusters. Outputs
obsm["X_pca_harmony"]— the original X_pca is untouched. - theta
- Harmony's diversity-penalty parameter. theta=0 = no correction; theta=2 = moderate (default and recommended start); theta=4+ = strong correction. Increase if batches still separate after correction.
- use_rep
- A Neighbors parameter that selects which obsm key to build the kNN graph from. For Harmony-corrected data set use_rep="X_pca_harmony" — forgetting this is the #1 integration mistake.