
From raw counts to an annotated cell atlas — on one canvas.
8 loaders, the scanpy pipeline with a live QC Workspace, Harmony integration, Leiden / Louvain / K-Means clustering, 4 ways to annotate cell types plus a concordance check to judge them, then DEG, pathways, functional activity, cell–cell communication, trajectory, RNA velocity and CellRank — 13 plot nodes, 20 templates, no code.
In the scRNA-seq view
- Nodes in this view
- 66
- Loaders
- 8
- Templates
- 20
- Plot types
- 54
9 pipeline stages
H5AD · 10X H5 · 10X MTX · CSV / TSV …
4 need a Resource Center install
across the visualization nodes in this view
Counted from the app’s v0.25 Node Library view, not typed by hand.
pbmc3k_raw.h5ad
2,700 cells
min_genes 200 · mito < 20%
QC_label PASS/FAIL
target 1e4 · 2,000 HVG
log-normalized
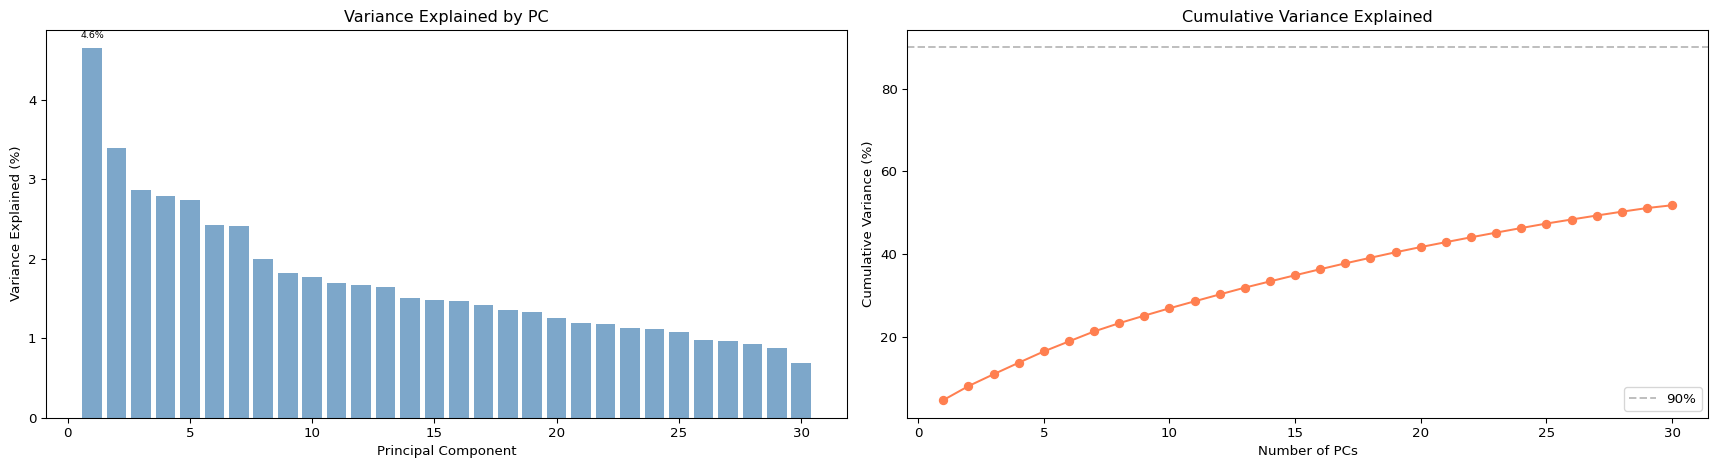
50 components
X_pca
n_neighbors 15
2D embedding
leiden · resolution 1.0
8 clusters
tissue PBMC · LLM
cell types labelled
A scRNA-seq pipeline on the Oreumics canvas — drag, connect, run. Illustration; parameters are examples.
What it produces
Workspace capture
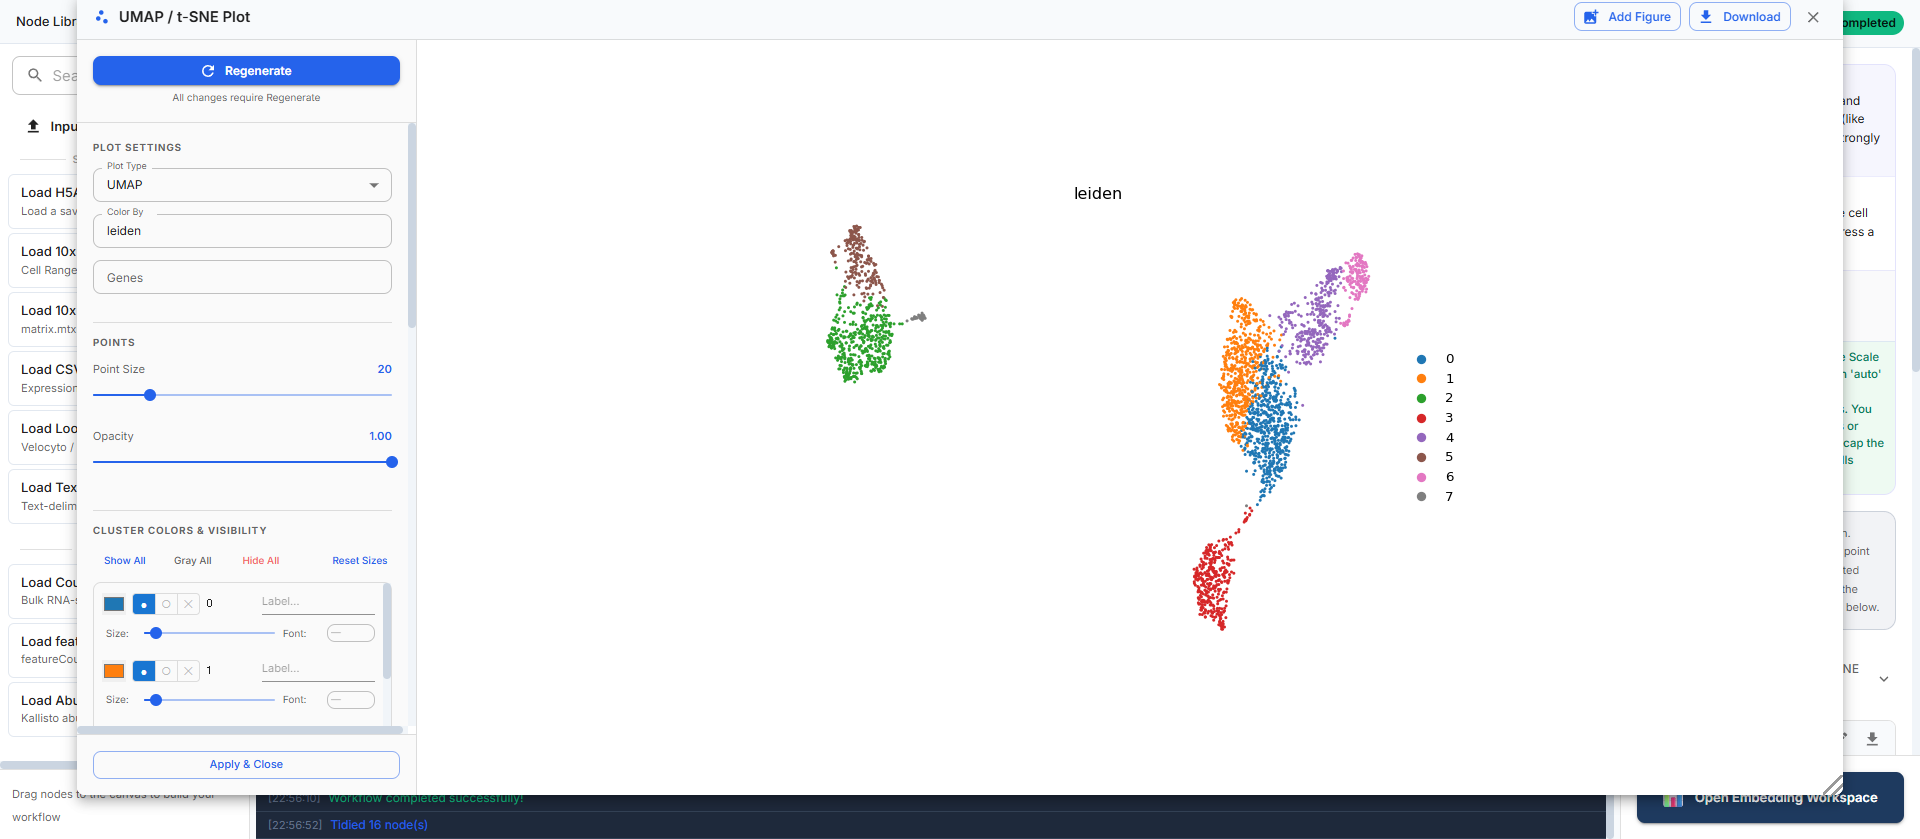
The Embedding Workspace on a UMAP of the 8 Leiden clusters. Per-group colours, renamed labels, legend placement and font sizes are saved back to the node, so the figure is regenerated from parameters rather than edited by hand.
What you can drag in.
.h5adNative scanpy format — keeps layers, obsm, uns and embeddings. Duplicate gene names are made unique.
.h5filtered_feature_bc_matrix.h5 from Cell Ranger; a genome can be named for multi-genome files.
dirCell Ranger MTX directory (matrix.mtx + features + barcodes), compressed or plain. Gene symbols or Ensembl IDs.
.csvCells × genes expression table; delimiter detected from the extension. Cell metadata goes through Merge Cell Meta instead.
.txtGeneric delimited text matrix with a configurable separator and first-column cell names.
.loomspliced / unspliced / ambiguous layers for RNA velocity; sample prefixes on barcodes are stripped.
dirSTARsolo --soloFeatures Velocyto output directory; genes × cells is transposed on load.
Multiple samples: load each file, then join them with Merge Data (live pre-merge preview) and attach a sample sheet with Merge Cell Meta.
A canonical scRNA-seq pipeline.
The steps below are the story; the full stage-by-stage node list follows in section 04.
- 01
Load and inspect
Drop in any of the formats above. Obs Inspector browses the metadata and Split Cell ID turns composite barcodes into obs columns.
- 02
Quality control in a live workspace
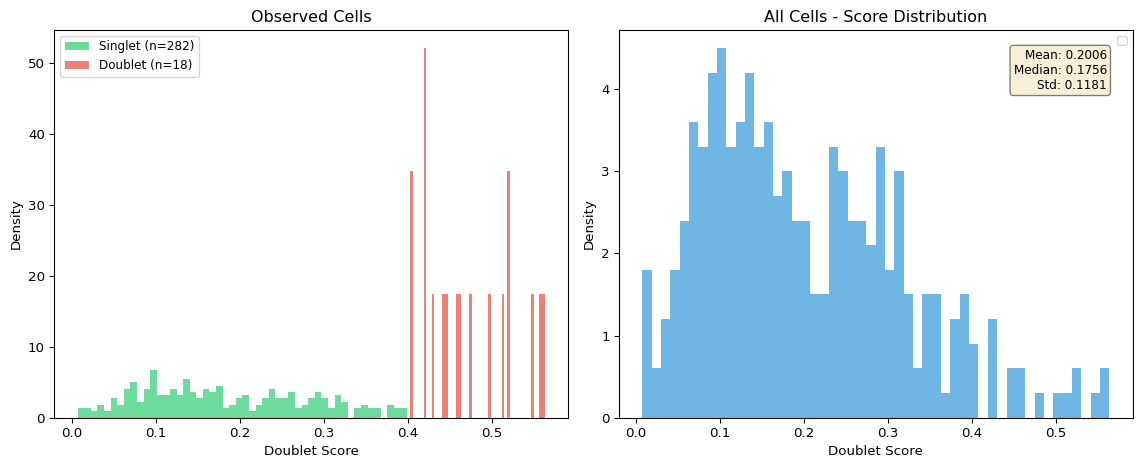
The Quality Control node filters on genes, counts and mitochondrial / ribosomal / haemoglobin fractions. The QC Workspace shows MAD-based recommendations, a Raw Data Mode for unfiltered droplets, and thresholds that update the plots without re-running. Scrublet flags doublets.
- 03
Normalize, select features, scale
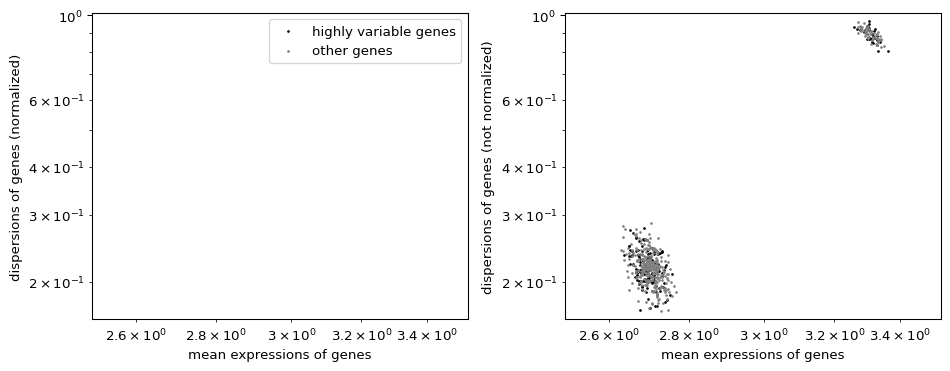
normalize_total → log1p → highly variable genes → scale. Scale keeps the full matrix in
adata.rawso DEG and gene plots still see every gene. - 04
- 05
Cluster and curate
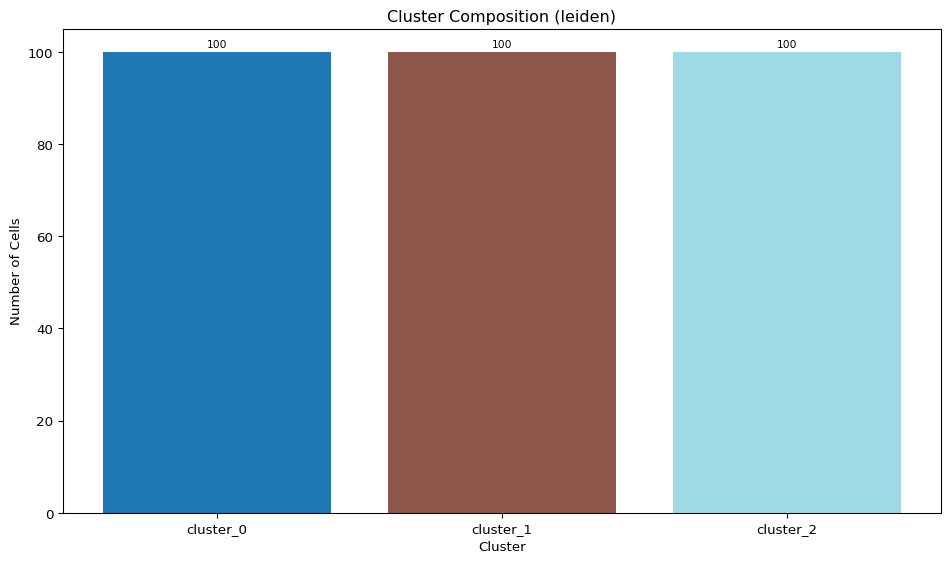
Leiden or Louvain at a chosen resolution, or K-Means with an explicit cluster count on the embedding. Edit Clusters merges and renames once the biology is clear.
- 06
Annotate four ways, then check agreement
Auto Annotation asks an LLM to name each cluster from its markers; CellTypist labels every cell with a pretrained model; Cell Mapper transfers labels from a reference atlas by kNN; Annotation Concordance scores how much they agree (ARI / NMI) before you trust any of them.
- 07
Markers, pathways and activity
DEG Analysis ranks genes per cluster (Wilcoxon by default; t-test and logistic regression available). Top DEG Gene List feeds Enrichr ORA or gseapy GSEA; PROGENy, Hallmark and CollecTRI score pathway and transcription-factor activity per cell.
- 08
Communication, trajectory, velocity, fate
CellPhoneDB (database installed via the Resource Center) and LIANA consensus rank ligand–receptor pairs. PAGA, DPT and Draw Graph order cells; scvelo estimates velocity; CellRank kernels (cytotrace/pseudotime/velocity/connectivity) give macrostates, fate probabilities, lineage drivers and gene trends.
Every node, in pipeline order.
The app’s Node Library is modality-first: pick single-cell rna-seq and it shows these 66 nodes grouped into the 9 stages below. Shared nodes such as Quality Control or Merge Cell Meta appear in more than one view.
Stage 01
Load Data
8 nodes
Stage 02
QC & Preprocessing
6 nodes
Stage 04
Clustering & Annotation
6 nodes
Stage 05
DEG & Pathways
7 nodes
Stage 06
Cell–Cell Communication
2 nodes
Also available
Trajectory & Velocity
11 nodes · collapsed by default in the app
Also available
Utilities & Export
8 nodes · collapsed by default in the app
Pre-wired pipelines — open, point at data, run.
Templates open from the Templates dialog with sensible defaults already set. Those marked below include a node whose database, model or manifest must be installed in the Resource Center first — every other node runs, and the gated one stops until it is installed. A run never downloads.
scRNA QC Overview
2 nodesCompute QC metrics and generate violin plots — without filtering. Useful for inspecting data quality before deciding on thresholds.
Load H5AD → Quality Control
scRNA Standard Clustering
12 nodesThe standard single-cell pipeline — quality control filtering, normalization, PCA + UMAP embedding, and Leiden clustering.
Load H5AD → Quality Control → Normalize → Log1p → Highly Variable Genes → Scale → PCA → Neighbors → UMAP → Clustering → Cluster Visualization → Embedding Plot
scRNA Full Pipeline with Visualization
16 nodesLoad H5AD → Quality Control → Normalize → Log1p → Highly Variable Genes → HVG Visualization → Scale → PCA → PCA Visualization → Neighbors → UMAP → Clustering → Cluster Visualization → Embedding Plot → DEG Analysis → Marker Visualization
scRNA Marker Discovery
11 nodesBuild clusters and identify marker genes with dotplot visualization
Load H5AD → Normalize → Log1p → Highly Variable Genes → Scale → PCA → Neighbors → Clustering → DEG Analysis → Marker Visualization
scRNA DEG + Gene List Export
14 nodesLoad H5AD → Normalize → Log1p → Highly Variable Genes → Scale → PCA → Neighbors → Clustering → DEG Analysis → Top DEG Gene List → Pathway Enrichment → Export CSV → Pathway Visualization
Needs Resource Center install · Pathway EnrichmentscRNA Doublet Screening
5 nodesCompute QC metrics, detect potential doublets, and inspect score distribution
Load H5AD → Quality Control → Doublet Detection → Doublet Visualization
scRNA Harmony Integration
14 nodesMerge two datasets, run Harmony batch correction, and visualize integrated UMAP
Load H5AD → Merge Data → Normalize → Log1p → Highly Variable Genes → Scale → PCA → Harmony → Neighbors → UMAP → Embedding Plot → Clustering
Trajectory with PAGA+DPT
14 nodesBuild a trajectory graph and pseudotime ordering on the PBMC sample dataset (PAGA + DPT).
Load H5AD → Normalize → Log1p → Highly Variable Genes → Scale → PCA → Neighbors → UMAP → Clustering → PAGA → Diffusion Map → DPT → Draw Graph → Trajectory Visualization
RNA Velocity Stream (H5AD)
4 nodesRun stochastic RNA velocity and visualize stream on UMAP from pre-built H5AD
Load H5AD → RNA Velocity → Velocity Graph → Velocity Visualization
RNA Velocity Latent Time
6 nodesRun dynamical velocity, infer latent time and terminal states
Load H5AD → RNA Velocity → Velocity Graph → Latent Time → Terminal States → Velocity Visualization
RNA Velocity from Velocyto Loom
4 nodesLoad velocyto .loom output directly, run stochastic velocity, and visualize stream
Load Velocyto Loom → RNA Velocity → Velocity Graph → Velocity Visualization
RNA Velocity from STARsolo
4 nodesLoad STARsolo Velocyto output, run stochastic velocity, and visualize arrow plot
Load STARsolo Velocity → RNA Velocity → Velocity Graph → Velocity Visualization
Pathway Enrichment Analysis
11 nodesFull pathway pipeline — quality control, normalization, clustering, differential expression, then GO / KEGG pathway enrichment via Enrichr with a barplot summary.
Load H5AD → Quality Control → Normalize → Log1p → Highly Variable Genes → PCA → Neighbors → Clustering → DEG Analysis → Pathway Enrichment → Pathway Visualization
Needs Resource Center install · Pathway EnrichmentGO & KEGG Pathway Visualization
13 nodesLoad H5AD → Quality Control → Normalize → Log1p → Highly Variable Genes → PCA → Neighbors → Clustering → DEG Analysis → Pathway Enrichment → Pathway Visualization
Needs Resource Center install · Pathway EnrichmentCell-Cell Interaction (CellPhoneDB)
12 nodesLoad H5AD → Quality Control → Normalize → Log1p → Highly Variable Genes → PCA → Neighbors → Clustering → CellPhoneDB → CellPhoneDB Plot
Needs Resource Center install · CellPhoneDBLLM Auto Annotation
12 nodesStandard clustering pipeline + LLM-based automatic cell type annotation. No reference atlas needed — the LLM predicts cell types from marker genes.
Load H5AD → Quality Control → Normalize → Log1p → Highly Variable Genes → Scale → PCA → Neighbors → UMAP → Clustering → Auto Annotation → Cluster Visualization
Reference Label Transfer
11 nodesTransfer cell type labels from a reference atlas to your query dataset using kNN-based mapping. Load both query and reference H5AD files.
Load H5AD → Quality Control → Normalize → Log1p → Highly Variable Genes → Scale → PCA → Neighbors → UMAP → Cell Mapper → Cluster Visualization
CellRank — CytoTRACE Fate Analysis
12 nodesCell fate analysis using the CytoTRACE kernel (developmental potential — no RNA velocity needed). Identifies terminal/initial states and computes fate probabilities.
Load H5AD → Normalize → Log1p → Highly Variable Genes → Scale → PCA → Neighbors → UMAP → Clustering → CellRank Kernel → Cell Fate Analysis → CellRank Visualization
CellRank — Pseudotime Fate Analysis
15 nodesCell fate analysis using the DPT (Diffusion Pseudotime) kernel — combines pseudotime ordering with a Markov chain to compute fate probabilities.
Load H5AD → Normalize → Log1p → Highly Variable Genes → Scale → PCA → Neighbors → UMAP → Clustering → Diffusion Map → DPT → CellRank Kernel → Cell Fate Analysis → Lineage Drivers → Gene Trends
CellRank — Full Pipeline (CytoTRACE + All Viz)
16 nodesComplete CellRank pipeline — transition kernel → cell fate → lineage drivers → every visualization (fate map, macrostates, gene trends).
Load H5AD → Normalize → Log1p → Highly Variable Genes → Scale → PCA → Neighbors → UMAP → Clustering → CellRank Kernel → Cell Fate Analysis → Lineage Drivers → CellRank Visualization → Gene Trends
Sample data the templates point at
Paths are relative to the app’s sampledata/ folder.
sampledata/scrna/pbmc3k_raw.h5ad2,700 PBMCs from a healthy donor with raw UMI counts — the standard tutorial dataset.Used by: scRNA QC Overview · scRNA Standard Clustering · scRNA Full Pipeline with Visualization · scRNA Marker Discovery · scRNA DEG + Gene List Export · scRNA Doublet Screening · scRNA Harmony Integration · Trajectory with PAGA+DPT · Pathway Enrichment Analysis · GO & KEGG Pathway Visualization · Cell-Cell Interaction (CellPhoneDB)sampledata/velocity/dentategyrus_velocity.h5adDentate gyrus with spliced / unspliced layers ready for RNA Velocity.Used by: RNA Velocity Stream (H5AD) · RNA Velocity Latent Timesampledata/velocity/velocyto_demo.loomThe same dataset as velocyto CLI output, for the Load Velocyto Loom path.Used by: RNA Velocity from Velocyto Loom
What sets it apart
Annotation you can audit
Four annotation methods live side by side — LLM, pretrained CellTypist, reference kNN transfer, and your own clusters — and Annotation Concordance turns their agreement into a heatmap and an ARI / NMI matrix instead of asking you to trust one.
Trajectory to fate in the same graph
PAGA, DPT, Diffusion Map, Draw Graph (ForceAtlas2 when available, otherwise Fruchterman–Reingold — and the node says which it used), scvelo velocity with latent time and terminal states, and CellRank macrostates, fate probabilities and GAM gene trends, all on one canvas.
Beyond markers
PROGENy scores 14 signalling pathways, Hallmark 50 MSigDB programs and CollecTRI transcription-factor activity via decoupler; CellPhoneDB and LIANA rank cell–cell communication. Databases and priors are pinned, checksummed installs in the Resource Center — a run never downloads.
Local by design
Analysis runs on your Windows machine; raw matrices never leave it. The optional AI Copilot sends node names, parameters and small summaries only — never expression data.
Figures from this pipeline
7 captures
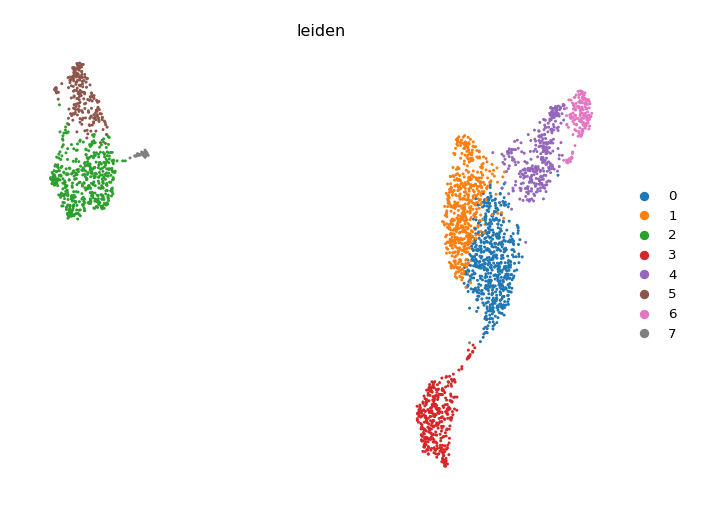
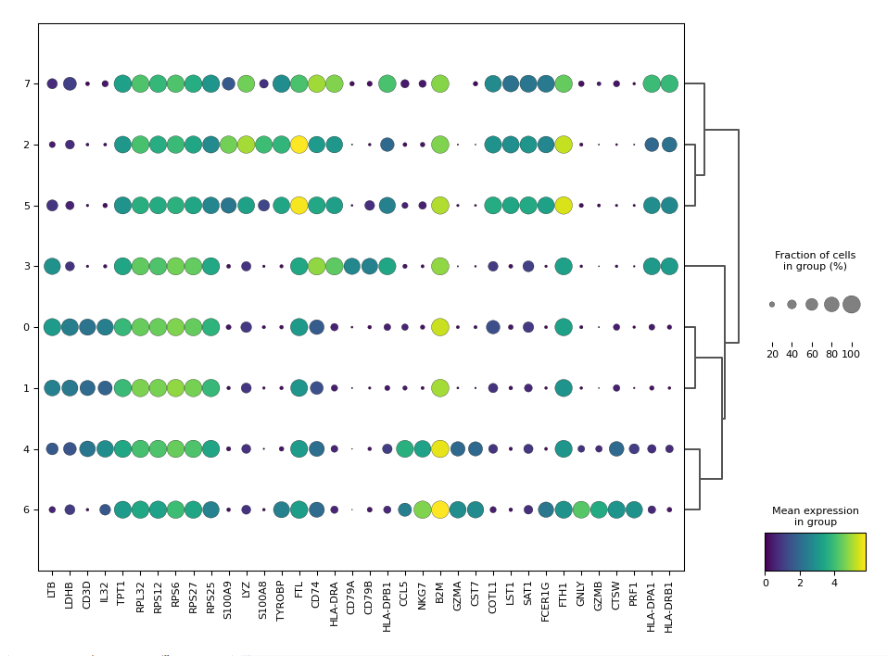
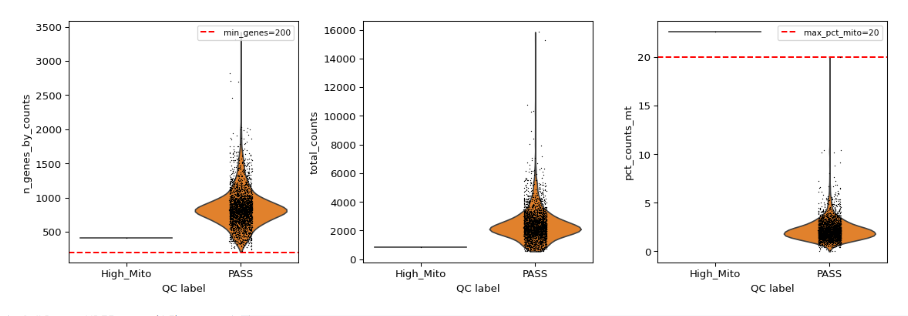
Walk it step by step.
PBMC scRNA-seq
The standard QC → cluster → markers walk-through on the bundled PBMC 3k data.
Multi-sample integration
Merge samples, attach metadata, correct batches, compare conditions.
Harmony and doublet screening
Batch correction with use_rep = X_pca_harmony, plus Scrublet screening.
Trajectory with PAGA and DPT
Coarse topology, pseudotime and force-directed layouts.
RNA velocity
Stochastic and dynamical scvelo, latent time, terminal states.
Pathways and cell–cell interaction
Enrichr ORA from DEG lists and CellPhoneDB from cell types.
End matter
Start with scRNA-seq today.
Free during the beta with an admin-issued Beta Access ticket. Windows 10/11, 64-bit. Runs locally; sign in at each launch.