
featureCounts to PyDESeq2 to GSEA — no R session required.
Load a count matrix, a featureCounts or STAR ReadsPerGene table, or Kallisto / Salmon quantifications; attach the sample sheet with Merge Cell Meta; run sample-level QC, cpm / tmm / deseq2 / vst normalisation, PyDESeq2 differential expression, GSEA or ORA and PROGENy / Hallmark / CollecTRI activity — then volcano, MA, heatmap, sample-distance and library-size plots.
In the Bulk RNA-seq view
- Nodes in this view
- 19
- Loaders
- 4
- Templates
- 3
- Plot types
- 7
8 pipeline stages
Count Matrix · featureCounts · Abundance (Kallisto/Salmon) · H5AD
1 need a Resource Center install
across the visualization nodes in this view
Counted from the app’s v0.25 Node Library view, not typed by hand.
airway_featurecounts.txt
samples × genes
airway_metadata.csv
dex column attached
library size · IQR
outliers labelled
deseq2 size factors
counts kept in layers
PyDESeq2 · trt vs untrt
padj · log2FC
GO_Biological_Process_2023
pathways ranked
volcano · α 0.05
figure ready
A Bulk RNA-seq pipeline on the Oreumics canvas — drag, connect, run. Illustration; parameters are examples.
What it produces
Result capture
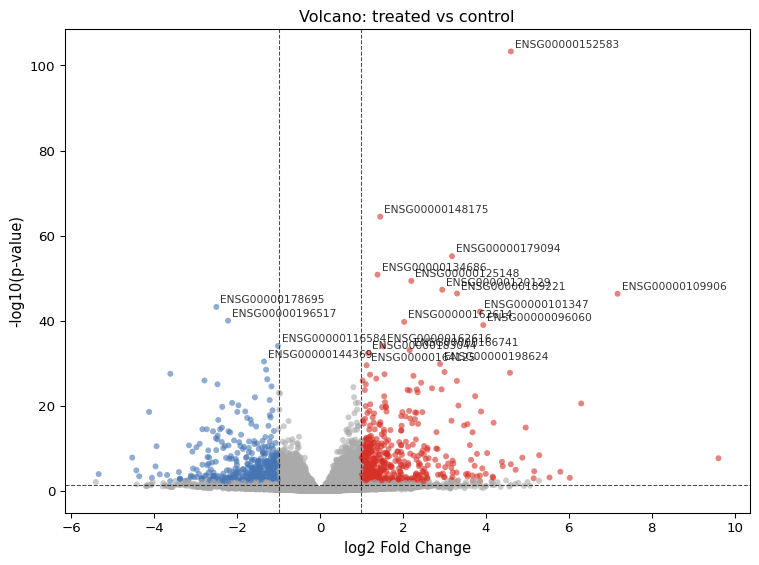
Bulk Visualization, volcano plot type — log2 fold-change against −log10 adjusted p-value from PyDESeq2, with genes passing the FDR and fold-change thresholds highlighted.
What you can drag in.
.txtSubread featureCounts output; comment and header lines are handled automatically.
.tabReadsPerGene.out.tab; strand_column picks unstranded (1), forward (2) or reverse (3) counts.
.tsvabundance.tsv, format auto-detected. One file per sample; choose TPM or estimated counts with value_type.
.sfquant.sf, format auto-detected. One file per sample, joined afterwards with Merge Data.
.csvCSV / TSV / TXT count table, genes × samples by default (Transpose is on); an optional metadata file joins on sample name.
.h5adA samples × genes AnnData built earlier, e.g. saved from a previous Oreumics run.
.csvSample × condition table attached with Merge Cell Meta (auto-matched, deterministic) or built with Define Groups.
PyDESeq2 needs raw integer counts — set value_type = counts for Kallisto / Salmon. TPM is fine for the plots.
A canonical Bulk RNA-seq pipeline.
The steps below are the story; the full stage-by-stage node list follows in section 04.
- 01
Load counts
Pick the loader that matches your quantifier. For Kallisto / Salmon, load each sample and concatenate with Merge Data.
- 02
Attach the design
Merge Cell Meta joins the sample sheet onto obs with a live match-rate preview; Define Groups builds condition labels from rules when there is no sheet.
- 03
Sample QC and gene filtering
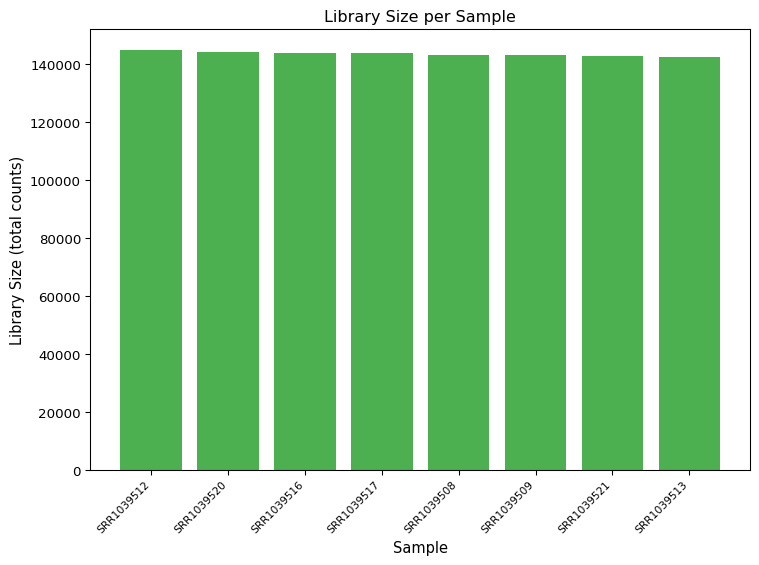
Bulk QC reports library size, detected genes and IQR-based outliers — label first, filter once you have seen the plots. Filter Low Expressed drops genes below CPM 1 in fewer than 2 samples (defaults).
- 04
Normalize
CPM, TMM, DESeq2 size factors or VST. Raw counts are always preserved in
layers["counts"], so differential expression still sees integers.Nodes:Bulk Normalize - 05
Differential expression
PyDESeq2 between a reference and a test group from any obs column (t-test fallback), with FDR and absolute log2 fold-change thresholds for the significant set.
Nodes:Differential Expression - 06
Pathways and activity
GSEA / ORA runs gseapy preranked GSEA on all genes or ORA on the significant ones against an Enrichr library — Enrichr is the one online service, enabled in the Resource Center. PROGENy, Hallmark and CollecTRI score pathway and TF activity per sample.
- 07
Plots and export
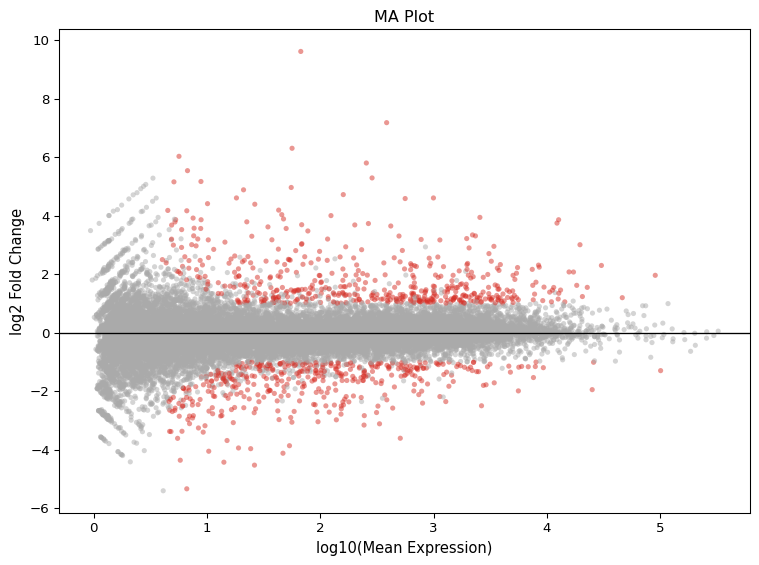
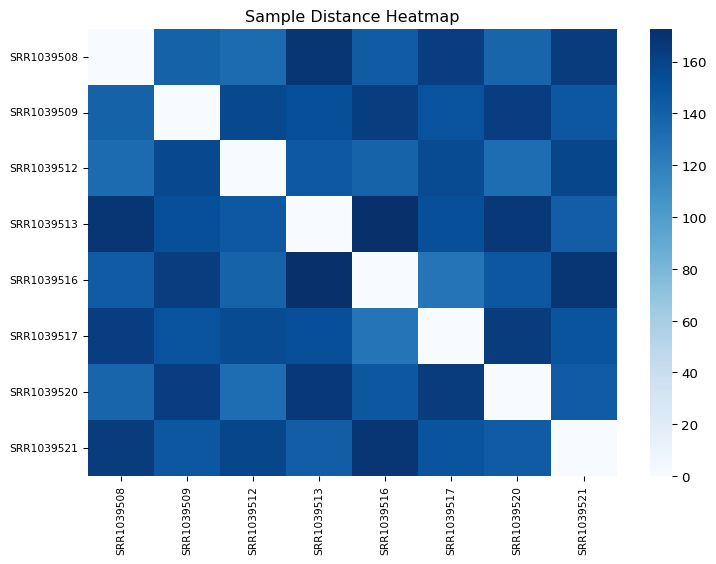
Bulk Visualization draws volcano, MA, DEG heatmap, sample distance and library size; Export CSV writes the DE and GSEA tables, and any figure’s underlying data can be exported from its Visualization Workspace.
Every node, in pipeline order.
The app’s Node Library is modality-first: pick bulk rna-seq and it shows these 19 nodes grouped into the 8 stages below. Shared nodes such as Quality Control or Merge Cell Meta appear in more than one view.
Stage 01
Load Data
4 nodes
Stage 02
Sample Sheet & Groups
2 nodes
Stage 03
QC & Filtering
2 nodes
Stage 04
Normalization
1 nodes
Stage 05
Differential Expression
1 nodes
Stage 06
Pathways & Activity
4 nodes
Stage 07
Plots
1 nodes
Also available
Utilities & Export
4 nodes · collapsed by default in the app
Pre-wired pipelines — open, point at data, run.
Templates open from the Templates dialog with sensible defaults already set. Those marked below include a node whose database, model or manifest must be installed in the Resource Center first — every other node runs, and the gated one stops until it is installed. A run never downloads.
Bulk RNA-seq Differential Expression
7 nodesLoad featureCounts output, run QC, normalization, DE, and volcano plot
Load featureCounts → Bulk QC → Filter Low Expressed → Bulk Normalize → Differential Expression → Bulk Visualization
Bulk RNA-seq with GSEA
9 nodesLoad Airway featureCounts, QC, filter, VST, DE, pathway enrichment (ORA), and heatmap
Load featureCounts → Bulk QC → Filter Low Expressed → Bulk Normalize → Differential Expression → GSEA / ORA → Bulk Visualization
Needs Resource Center install · GSEA / ORASTAR ReadsPerGene — Single-sample Load Demo
3 nodesLoad featureCounts → Bulk QC → Bulk Visualization
Sample data the templates point at
Paths are relative to the app’s sampledata/ folder.
sampledata/bulk/airway_featurecounts.txtAirway smooth-muscle featureCounts table (dexamethasone treated vs untreated).Used by: Bulk RNA-seq Differential Expression · Bulk RNA-seq with GSEAsampledata/bulk/airway_metadata.csvSample sheet for the airway dataset, for Merge Cell Meta.Used by: Bulk RNA-seq Differential Expression · Bulk RNA-seq with GSEAsampledata/bulk/star_ReadsPerGene.out.tabA single-sample STAR ReadsPerGene output for the strand-column demo.Used by: STAR ReadsPerGene — Single-sample Load Demo
What sets it apart
DESeq2 without R
Differential Expression runs PyDESeq2, a Python implementation of the DESeq2 method, from a parameter panel: pick the condition column, reference and test group, and read padj and log2FC from the node.
Every quantifier, one canvas
featureCounts, STAR ReadsPerGene, Kallisto, Salmon and plain matrices come in through 4 loaders that share the same downstream nodes, so switching quantifier does not mean switching pipeline.
Activity, not only enrichment
Alongside GSEA / ORA, the PROGENy (14 pathways), Hallmark (50 programs) and CollecTRI (TF regulons) nodes give per-sample activity scores through decoupler, with priors installed and checksummed in the Resource Center.
Local by design
Counts never leave your machine. Every run records its parameters and a Methods paragraph is generated for the report.
Figures from this pipeline
3 captures
Walk it step by step.
End matter
Start with Bulk RNA-seq today.
Free during the beta with an admin-issued Beta Access ticket. Windows 10/11, 64-bit. Runs locally; sign in at each launch.