
Fragments to peaks to motifs — chromatin accessibility end to end.
Load fragments.tsv.gz, a peak matrix or a Cell Ranger ATAC MEX directory; check TSS enrichment, FRiP and fragment size; call peaks; reduce with LSI (TF-IDF + SVD); cluster with the shared Neighbors / UMAP / Clustering nodes; test differential accessibility and scan motifs with pyJASPAR (JASPAR2022 by default, JASPAR2026 available) — 6 plot types, no scripting.
In the ATAC-seq view
- Nodes in this view
- 17
- Loaders
- 4
- Templates
- 2
- Plot types
- 6
6 pipeline stages
Fragments · Peak Matrix · ATAC MEX · H5AD
run end-to-end on a fresh install
across the visualization nodes in this view
Counted from the app’s v0.25 Node Library view, not typed by hand.
filtered_peak_bc_matrix/
cells × peaks
min_frip 0.15 · label
QC labels set
top_accessible · 100k
peaks kept
50 comps · drop_first
X_lsi
leiden on X_lsi
clusters
t-test + FDR · |log2FC| 1
differential peaks
JASPAR2022 · top 1000
TFs enriched
A ATAC-seq pipeline on the Oreumics canvas — drag, connect, run. Illustration; parameters are examples.
What it produces
Result capture
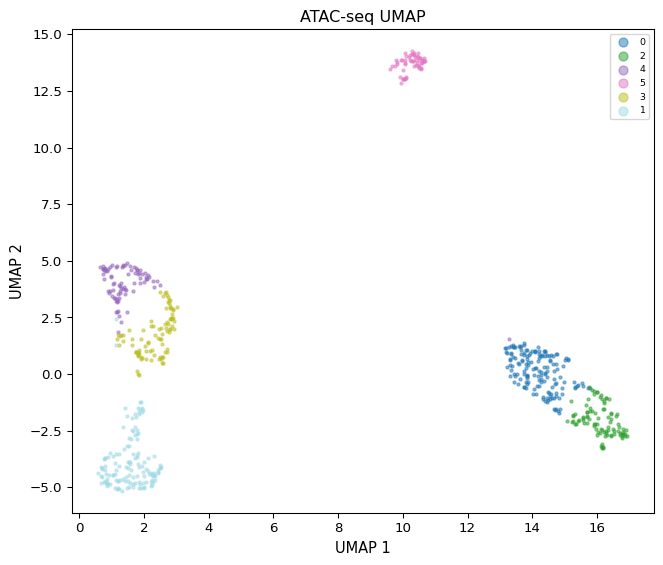
ATAC Visualization, umap_atac plot type — a UMAP built on the LSI embedding, coloured by chromatin-accessibility cluster.
What you can drag in.
dirfiltered_peak_bc_matrix/ with matrix.mtx, peaks.bed and barcodes.tsv.
.tsv.gzIndexed 10x fragments.tsv.gz (.tbi required). Builds the peak × cell matrix; calls peaks if no BED is given; a minimum fragments-per-cell filter is applied on load.
.csvPre-computed peak × cell matrix as CSV / TSV / H5AD, with a transpose flag when peaks are columns and chr:start-end peak names.
.bedOptional peak set (.bed / .narrowPeak) handed to Load Fragments to skip in-app peak calling.
The first LSI component tracks sequencing depth; drop_first (on by default) removes it before clustering, and Neighbors is pointed at use_rep = X_lsi.
A canonical ATAC-seq pipeline.
The steps below are the story; the full stage-by-stage node list follows in section 04.
- 01
Load
Fragments, a peak matrix or the Cell Ranger MEX directory. Fragments without a BED go straight to peak calling.
- 02
QC
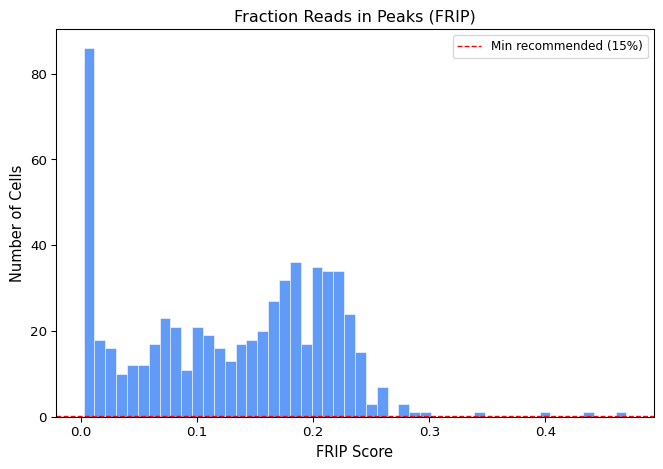
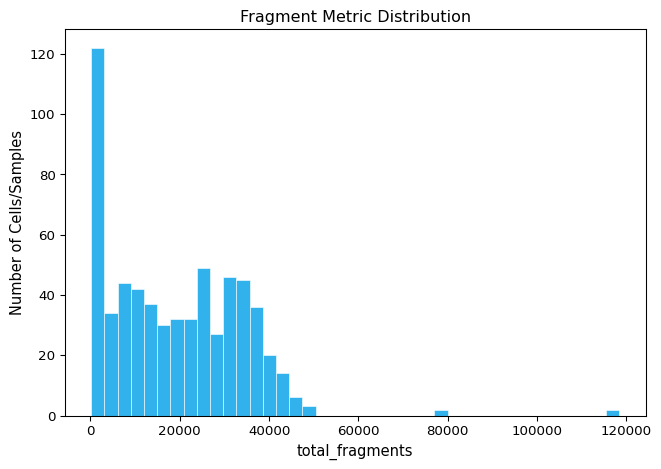
ATAC QC computes total fragments, peaks detected, FRiP and TSS enrichment per cell; defaults keep cells with 1,000–100,000 fragments and FRiP above 0.15, in label or filter mode.
Nodes:ATAC QC - 03
Call peaks
Top-N accessible regions by default, or MACS3 with an effective genome size and q-value; the top-N cap also bounds MACS3 output.
Nodes:Peak Calling - 04
Reduce with LSI
TF-IDF with log1p, then randomized SVD (50 components by default), dropping the depth-correlated first component.
Nodes:LSI - 05
Cluster on the LSI space
The scRNA-seq Neighbors, UMAP and Clustering nodes accept use_rep = X_lsi, so Leiden / Louvain / K-Means work unchanged.
- 06
Differential accessibility
Chrom Accessibility compares two groups with a t-test plus FDR, keeping peaks open in at least 5% of either group and marking |log2FC| above 1 as significant.
Nodes:Chrom Accessibility - 07
Motif enrichment and plots
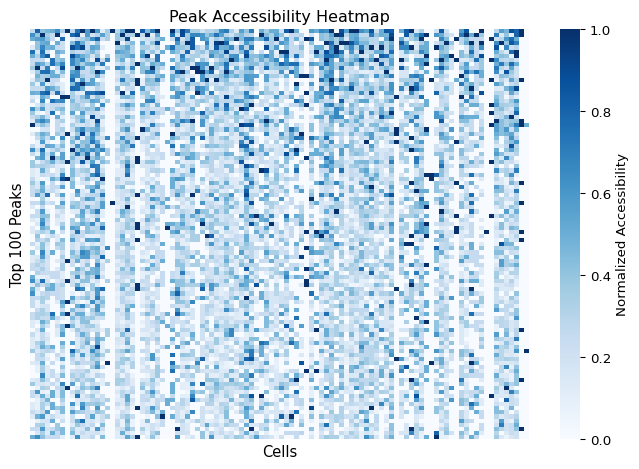
Motif Analysis scans the top differential peaks against a JASPAR release via pyJASPAR (JASPAR2022 default; JASPAR2020–2026 ship with the installer through the Resource Center), optionally with a genome FASTA for sequence scanning. ATAC Visualization draws FRiP, fragment size, TSS enrichment, peak accessibility, the ATAC UMAP and the differential volcano.
Every node, in pipeline order.
The app’s Node Library is modality-first: pick atac-seq (chromatin accessibility) and it shows these 17 nodes grouped into the 6 stages below. Shared nodes such as Quality Control or Merge Cell Meta appear in more than one view.
Stage 01
Load Data
4 nodes
Stage 02
QC & Peaks
2 nodes
Stage 03
Dimensionality Reduction & Clustering
4 nodes
Stage 04
Differential & Motifs
2 nodes
Stage 05
Plots
1 nodes
Also available
Utilities & Export
4 nodes · collapsed by default in the app
Pre-wired pipelines — open, point at data, run.
Templates open from the Templates dialog with sensible defaults already set.
ATAC Differential Accessibility
10 nodesLoad ATAC MEX → ATAC QC → Peak Calling → LSI → Neighbors → UMAP → Clustering → Chrom Accessibility → ATAC Visualization
ATAC Motif Discovery
10 nodesLoad ATAC MEX → ATAC QC → Peak Calling → LSI → Neighbors → Clustering → Chrom Accessibility → Motif Analysis → ATAC Visualization
Sample data the templates point at
Paths are relative to the app’s sampledata/ folder.
sampledata/atac/filtered_peak_bc_matrixCell Ranger ATAC MEX directory of the PBMC 500 sample.Used by: ATAC Differential Accessibility · ATAC Motif Discovery
What sets it apart
Fragments to motifs in one graph
Loading, QC, peak calling, LSI, clustering, differential accessibility and motif enrichment are nodes on one canvas with one parameter panel — no notebook glue between tools.
Shares the scRNA-seq nodes
Neighbors, UMAP and Clustering are the same nodes you use for expression data, so an ATAC clustering can live beside an RNA clustering in the same project.
JASPAR bundled, versions pinned
JASPAR releases are installed with the app and selected per run in Motif Analysis; the Resource Center records which release was used.
Local by design
Fragment files and matrices stay on your machine; the optional AI Copilot sees node names, parameters and small summaries only.
Figures from this pipeline
3 captures
Walk it step by step.
End matter
Start with ATAC-seq today.
Free during the beta with an admin-issued Beta Access ticket. Windows 10/11, 64-bit. Runs locally; sign in at each launch.